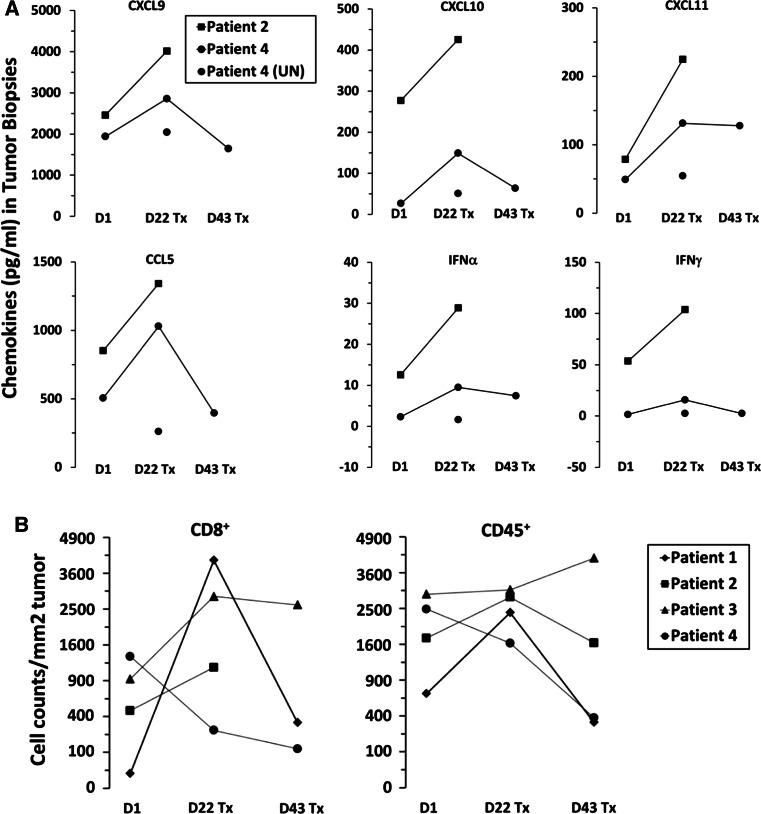
Fig. 3.
Vaccination and imiquimod treatment promote chemokine generation from tumors and immune cell infiltration of tumors 22 days post-treatment. Tumor samples were evaluated at day 1 (pretreatment), day 22, and day 43 post-imiquimod treatment (Tx). a Graphs depict the amounts of CXCL9, CXCL10, CXCL11 (top row), CCL5, IFNγ, and IFNγ (bottom row) (pg/ml) detected in tumor samples by luminex assay. b Graphs depict the numbers of CD8+ (left) and CD45+ (right) cells infiltrating tumor per mm2 of tumor sections

