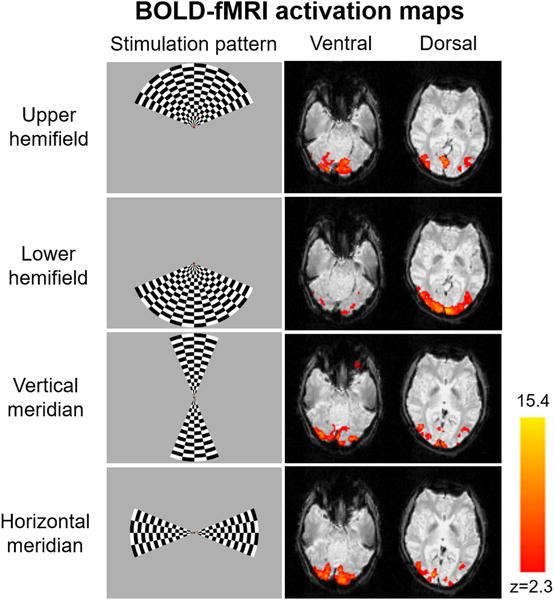
Figure 1.

Sample checkerboard flickering visual stimuli to 4 different regions in the visual fields (left column) and the corresponding fMRI activation maps (right column) represented by z-scores at the ventral and dorsal levels of the occipital cortex from a representative participant using gradient-echo echo planar imaging.
