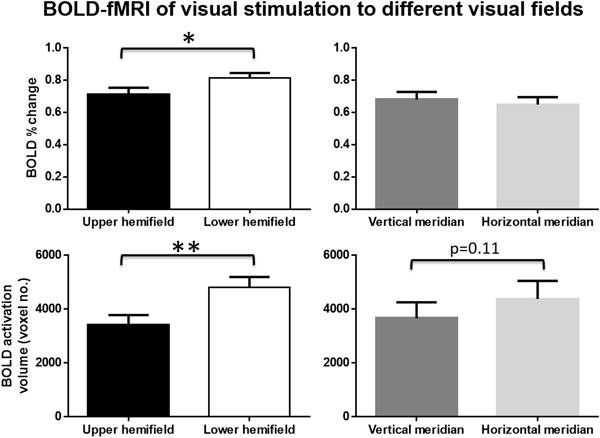
Figure 2.

(Top row) Average BOLD amplitude in activated brain regions and (bottom row) average brain activation volume in response to visual stimulation to the upper and lower hemifields (left column) and the vertical and horizontal meridians (right column) among 15 healthy adult subjects. (Mean ± SEM; Wilcoxon matched-pairs signed rank tests, *p<0.05; **p<0.01)
