Figure 3.

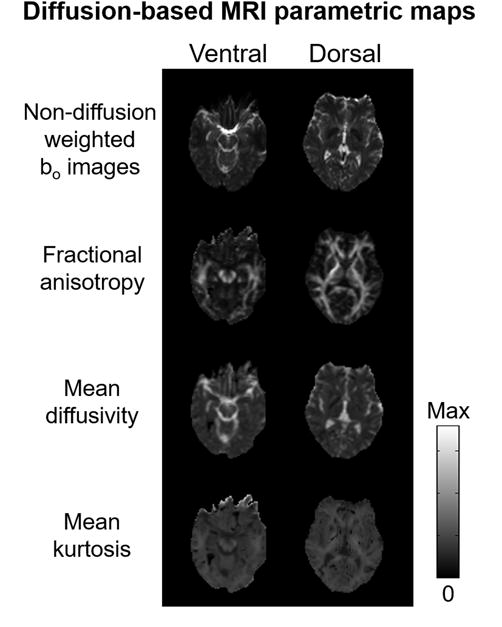
Sample diffusion-based MRI parametric maps of a representative participant at the ventral and dorsal levels of the occipital cortex. [Max = 1000 a.u. (bo); 1.0 (fractional anisotropy); 6.0 μm2/ms (mean diffusivity); 4.0 (mean kurtosis)]

Sample diffusion-based MRI parametric maps of a representative participant at the ventral and dorsal levels of the occipital cortex. [Max = 1000 a.u. (bo); 1.0 (fractional anisotropy); 6.0 μm2/ms (mean diffusivity); 4.0 (mean kurtosis)]