
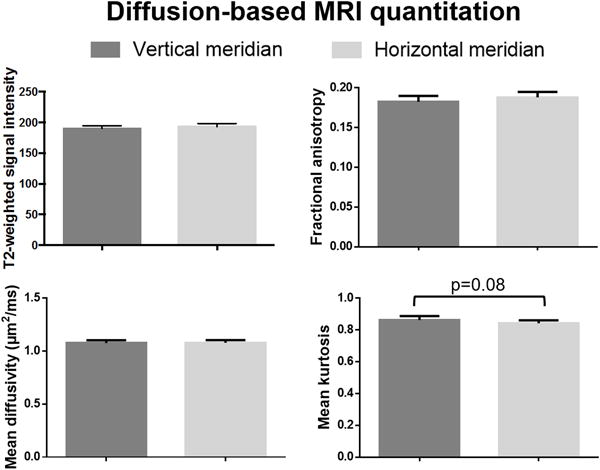
Figure 5.
Quantitative comparisons of diffusion-based MRI parameters measured from overlays of fMRI activation maps of meridian stimulation in Figure 1 onto the brain structures. (Mean ± SEM; Wilcoxon matched-pairs signed rank tests, *p<0.05)
Official websites use .gov
A
.gov website belongs to an official
government organization in the United States.
Secure .gov websites use HTTPS
A lock (
) or https:// means you've safely
connected to the .gov website. Share sensitive
information only on official, secure websites.
Quantitative comparisons of diffusion-based MRI parameters measured from overlays of fMRI activation maps of meridian stimulation in Figure 1 onto the brain structures. (Mean ± SEM; Wilcoxon matched-pairs signed rank tests, *p<0.05)