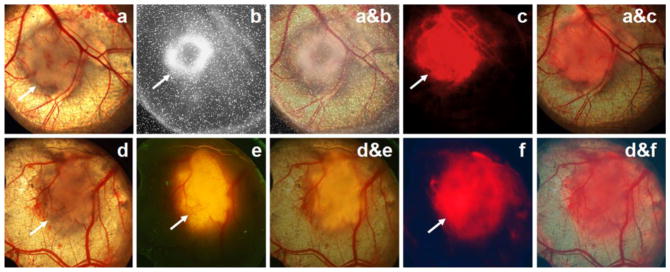
Fig. 6.
Images of the DSWC model. Top row: (a) White-light photomicrograph of HCT116 cells growing in the window chamber. Underlying blood vessels are clearly visible. The site of implanted tumor cells along with peritumoral microvasculature is defined as the tumor anatomical lesion. (b) 18F-FDG direct positron image of the window chamber in a showing the area of tumor metabolic activity. 18F-FDG uptake exhibits annular distribution with smaller size relative to the anatomical lesion observed by microscopy. (a&b) Co-registered image of a and b. (c) Cy7-TCP-1 fluorescence microscopic image corresponding to the window-chamber image in a. (a&c) Co-registered image of a and c. The Cy7 fluorescence signal co-localizes with the anatomical lesion. Cy7-TCP-1 uptake also corresponds to some blood vessels associated with the tumor. Bottom row: (d) White-light photomicrograph of window chamber with implanted HCT116/RFP cells with red fluorescent protein expression. (e) Corresponding red fluorescence image of window chamber in d. (d&e) Co-registered image of d and e. The area of RFP-expressing cells is smaller than the anatomical lesion under white-light illumination. (f) Cy7-TCP-1 fluorescence image in the same window chamber as d. (d&f) Co-registered image of d and f. The area of Cy7 fluorescence corresponds to the anatomical lesion but is larger than the area of RFP expression.

