
Figure 5.
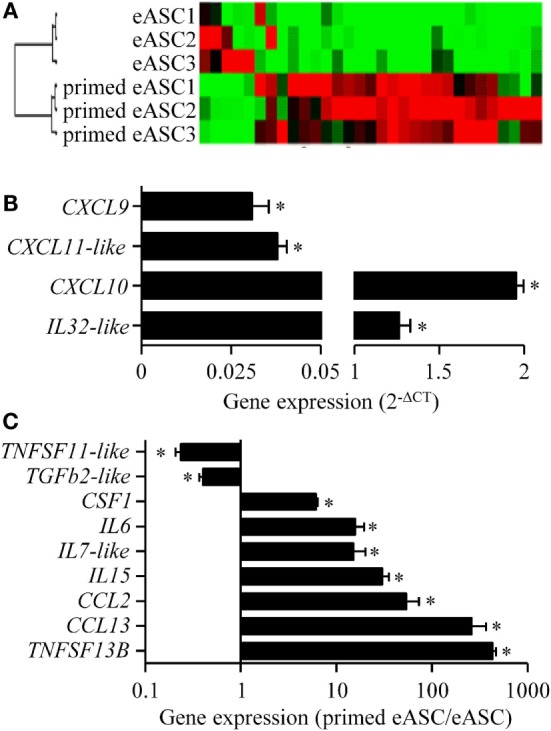
Effect of IFNγ-priming on the inflammatory gene profile of eASCs. Gene array analysis of inflammatory cytokines and chemokines mRNA compared naïve and IFNγ-primed eASCs. (A) Hierarchical clustering comparing naïve or IFNγ-primed eASCs, (B) induced gene expression levels in IFNγ-primed eASCs expressed as relative expression (2−ΔCT), (C) significantly modulated gene expression levels in IFNγ-primed eASCs. Results are represented as mean ± SEM for three independent biological replicates. Data were analyzed using the Mann–Whitney test. *p < 0.05.