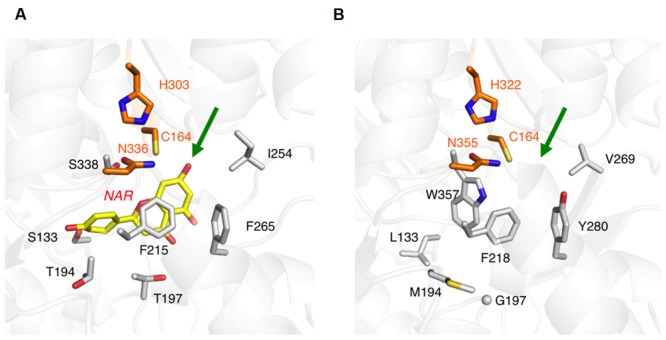
FIGURE 5.

Close-up views of the enzyme active sites. (A) M. sativa CHS2 in complex with a product analog, naringenin (PDB: 1CGK), colored yellow. (B) The model structure of the ORS active site. The green arrows point to the active site entrances. The catalytic triad residues are colored orange. Only selected amino acid residues are depicted, to clearly illustrate the differences between the two enzymes.
