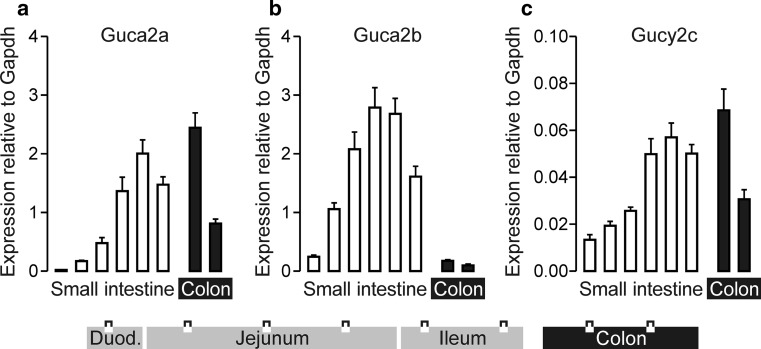
Fig. 1.
Partitioning of Guca2a (a), Guca2b (b), and Gucy2c (c) transcripts along the rostrocaudal axis of the mouse intestinal tract. Transcript levels in 6 equidistant sections of small intestine and 2 sections of colon (see diagram) were assessed by qPCR, using expression of Gapdh as a reference. Data depict mean ± standard error. N = 6

