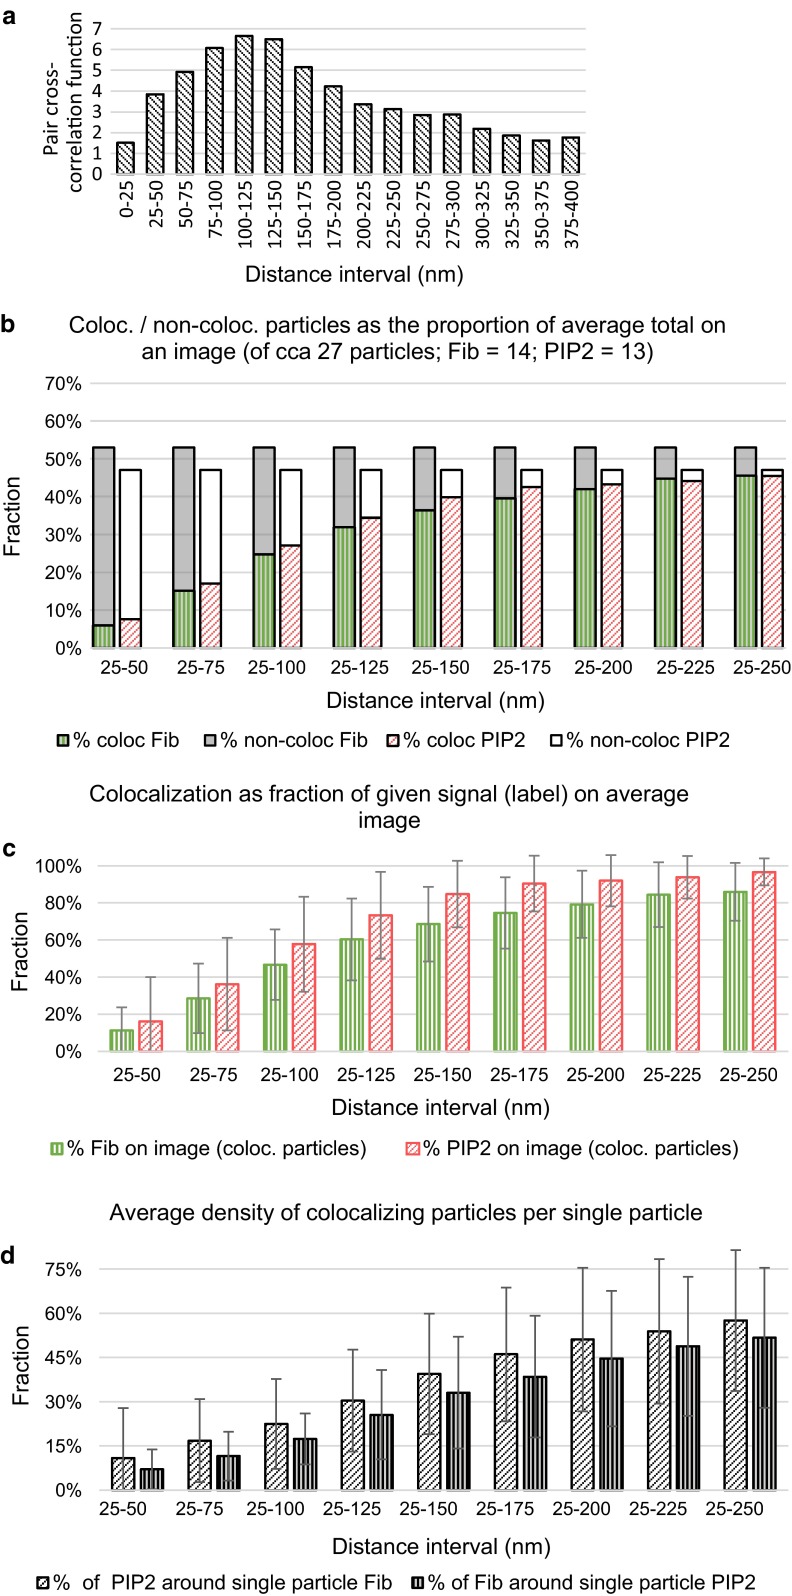
Fig. 4.
Colocalization data quantified using EM immunolabeling of fibrillarin and PIP2. a The pair cross-correlation function compares the empirical frequencies of the pairs of particles on the chosen distance with the theoretical frequency distribution of these pairs. The values higher than value one indicate higher density than theoretically expected for random process. b Each pair of the bars represents the relative frequency distribution of the colocalizing and non-colocalizing particles of given label on the given distance range (for detailed visual description of the principle, see Fig. 1). Each shaded or filled area represents the proportion of the particles in the average image. The dark gray bar shows the values of the proposed coefficients (patterned part of the bar) and (solid part of the bar). The white bars show the values of the coefficients (patterned part of the bar) and (solid part of the bar); A is fibrillarin and B is PIP2. c Tendency of the levels of the colocalization coefficients and for various distance intervals (mean ± standard deviation). d Tendency of the average ratios of colocalizing particles of one type A round single particle of another type, represented by the coefficients and

