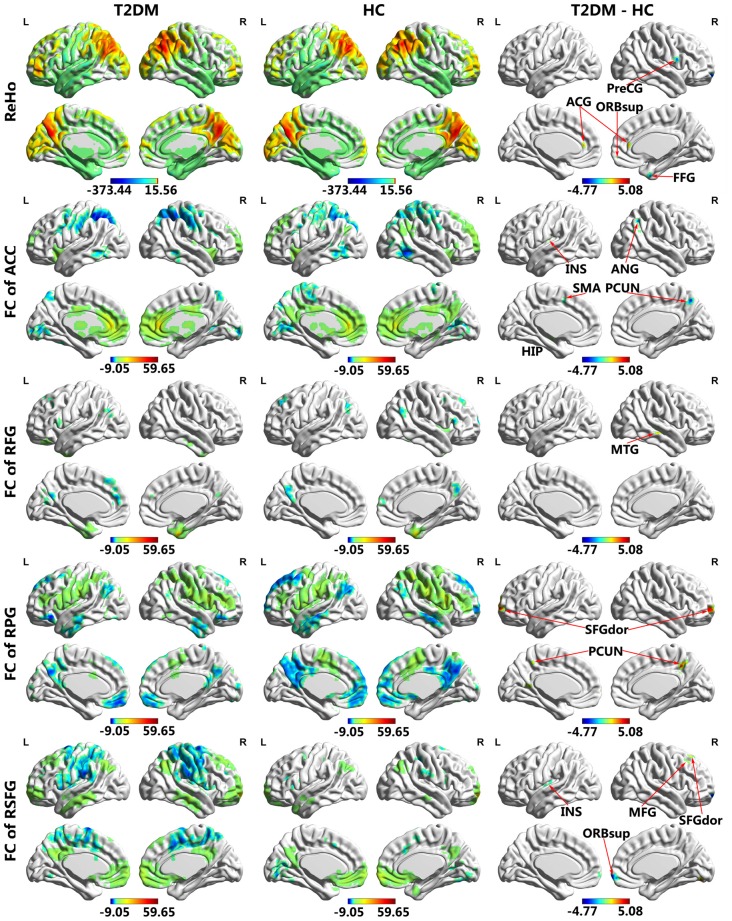
Figure 1.
Regional homogeneity (ReHo) and functional connectivity (FC) maps of intra-group and inter-group comparisons. Voxel p < 0.005 (AlphaSim correction, cluster p < 0.01, cluster size >16 voxels). Color scale denotes the t value. ACG, anterior cingulate gyrus; FFG, fusiform gyrus; PreCG, precentral gyrus; ORBsupmed, superior frontal gyrus, medial orbital; INS, insula; ANG, angular gyrus; HIP, hippocampus; SMA, supplementary motor area; PCUN, precuneus; MTG, middle temporal gyrus; SFGdor, superior frontal gyrus, dorsolateral; ORBsup, superior frontal gyrus, orbital part; MFG, middle frontal gyrus; R, Right; L, Left.

