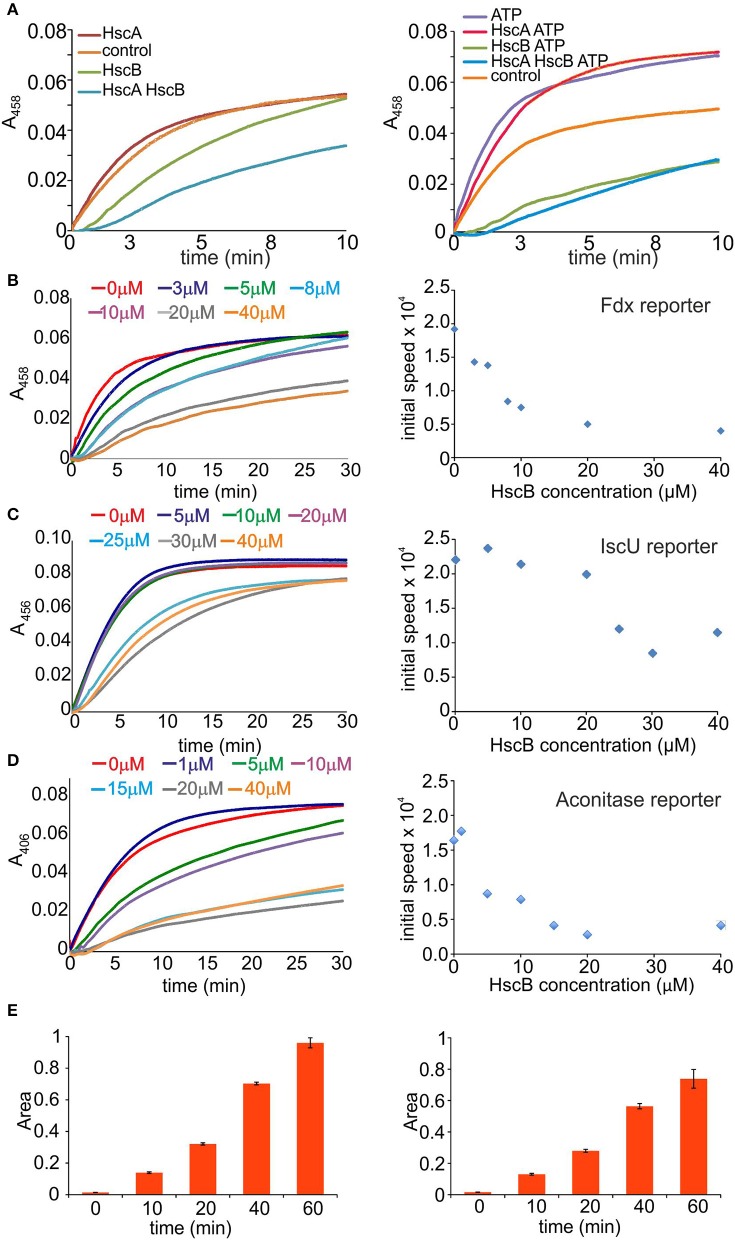
Figure 2.
Identification of the component(s) responsible for slowing down the reaction. (A) Effect of the individual components. Cluster formation rates on Fdx in the presence of IscS and IscU (control, orange), HscA (red), HscB (green), or HscA/HscB (cyan). The experiment is repeated in the absence (left) and presence of ATP (right). (B) Time course of cluster formation on Fdx in the presence of IscS, IscU, DTT with Cys and Fe2+ in the presence of increasing concentrations of HscB. The curves correspond to no HscB (red), 3 μM (blue), 5 μM (green), 8 μM (cyan), 10 μM (purple), 20 μM (gray), and 40 μM (orange). Right: Corresponding rates. (C) Cluster formation rates on IscU in the presence of IscS, DTT with Cys, and Fe2+. The curves correspond to no HscB (red), HscB 5 μM (blue), 10 μM (green), 20 μM (purple), 25 μM (cyan), 30 μM (gray), and 40 μM (orange). Right: Corresponding rates. (D) Cluster formation rates on aconitase in the presence of IscS, IscU, DTT with Cys, Fe2+. The curves correspond to no HscB (red) and HscB 1 μM (blue), 5 μM (green), 10 μM (purple), 15 μM (cyan), 20 μM (gray), and 40 μM (orange). Right: Corresponding rates. (E) Quantification of alanine formation. Alanine production by IscS (left) and in the presence of HscB (right).

