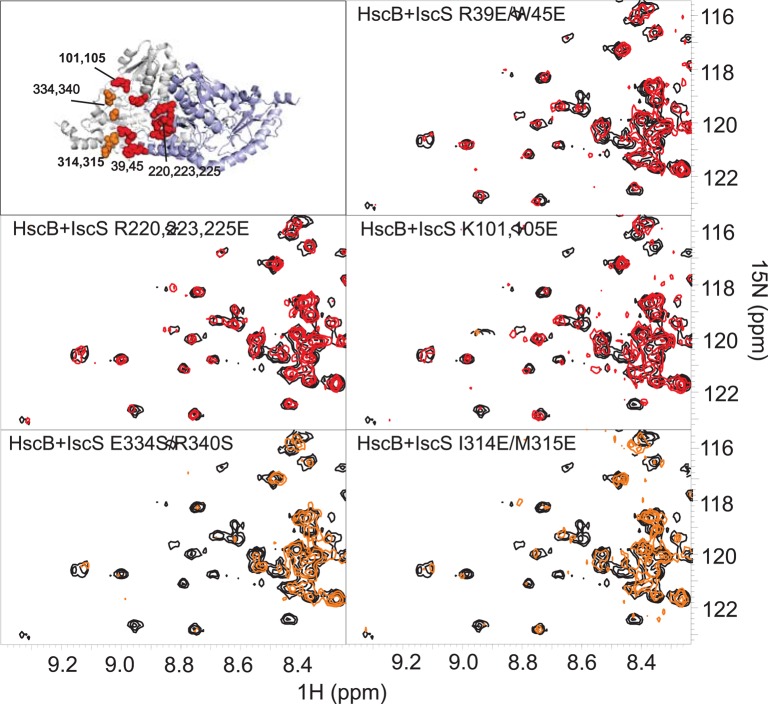
Figure 4.
Identification of the surface of interaction on IscS by mutagenesis. Position of the mutations on the structure of IscS (PDB code: 3LVL) and HSQC-NMR spectra of 15N-labeled HscB 100 μM (black) and in the presence of the IscS mutants (1:1). Spectra in red are not affected, spectra in orange show the disappearance of few peaks because of the formation of a complex IscS:HscB. The same color coding is used in the structure panel.

