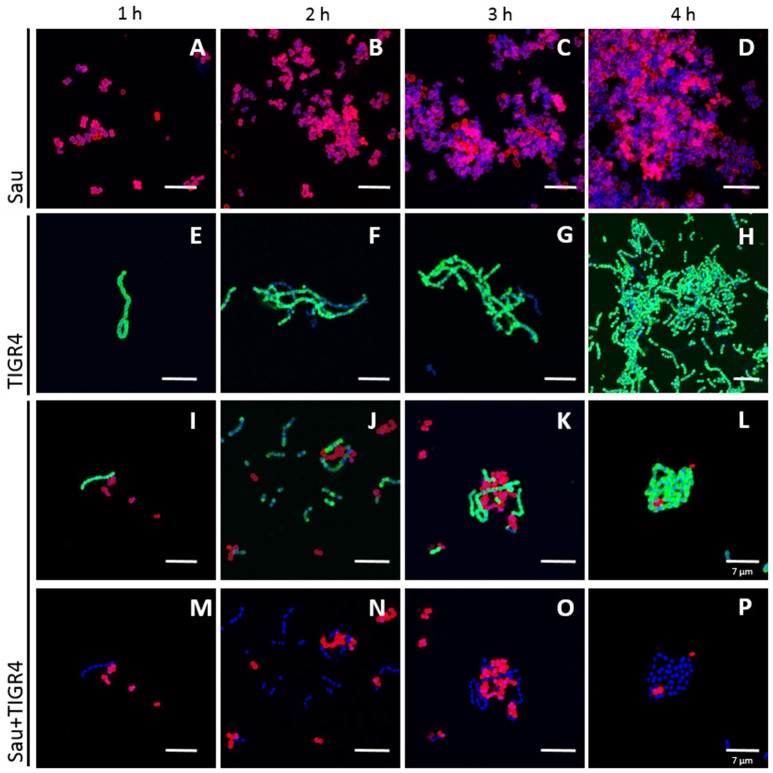
Figure 7.
Time course study of physical interaction between Sau and Spn strains. Sau (A–D), TIGR4 (E–H), or Sau and TIGR4 (I–P) were inoculated into an eight-well slide and incubated for 1, 2, 3, or 4 h at 37°C. Biofilms were fixed with 2% PFA and stained with an anti-Sau antibody followed by an Alexa 555-labeled anti-rabbit secondary antibody (red) and then an anti-Spn antibody labeled with Alexa 488 (green). Bacterial DNA was stained by DAPI (blue). Micrographs were taken by confocal microscopy. Panels show representative xy optical sections (~0.4 μm each). Bar at the right panel is valid for its corresponding horizontal panels. Panels (I–L) show the red and green channels while panels (M–P) the red and blue channels. Bars = 10 μm, except were indicated (7 μm).

