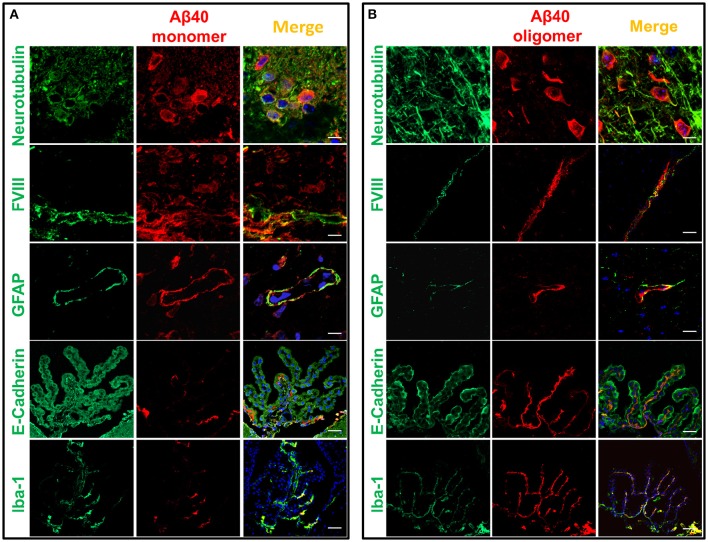
Figure 5.
Cellular localization of monomeric and oligomeric Aβ after intracerebral injection. Immunofluorescence microscopy analysis of serial frozen sections from brains of mice injected with monomeric (A) and oligomeric (B) Aβ illustrates the co-localization of Aβ (red signal) with cell specific markers of neurons (neurotubulin), endothelial cells (factor VIII), astrocytes (GFAP), choroid plexus epithelium (E-cadherin), and activated microglia (Iba-1), all in green fluorescence. Co-localization is highlighted by the yellow fluorescence in the merged images. Magnification: bar represents 10 μm in the neurotubulin stainings, 20 μm for the GFAP stainings, and 30 μm in the case of the FVIII, E-cadherin and Iba-1 stainings.

