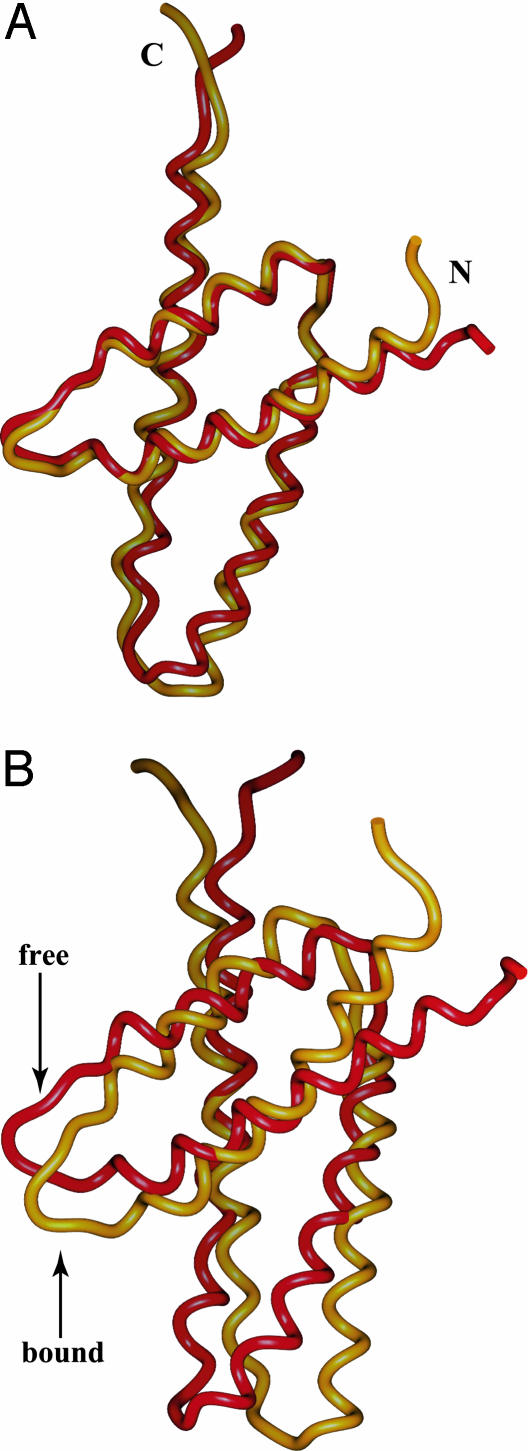
Fig. 4.
Comparison of the structures of C-terminal KaiA domains. Shown here are the backbone representations of free ThKaiA180C (red) (17) and ThKaiA180C when in complex with CIIABD (gold). The N and C termini of chains are indicated. The monomeric subunits of the two domains are superimposed and shown in A. The backbone rms deviation is 0.94 Å for free vs. bound ThKaiA180C. (B) Superpositions of one of the subunits shows differing rotations around the dimerization interface of the second subunits. (For clarity, the superimposed subunits are not shown.)

