
Figure 2.
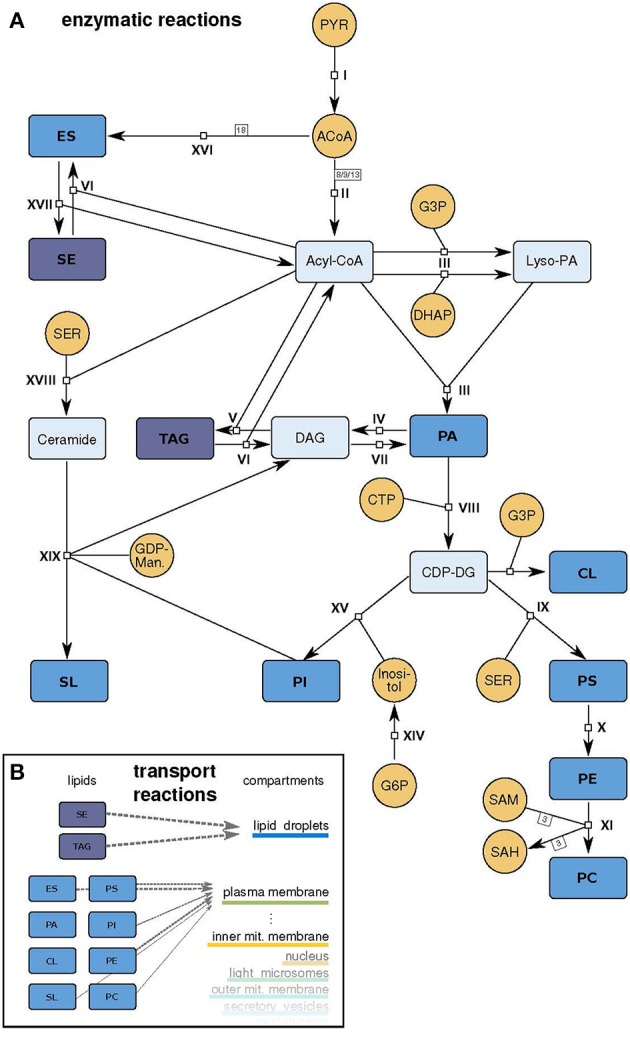
Model scheme. (A) Schematic representation of the model. Small molecule precursors, whose concentrations are held constant during the simulation, are depicted in orange, intermediate metabolites in light blue and lipids that can be incorporated in the different membranes in dark blue (abbreviations as in Table 1). The reactions I - XIX are described in detail in Supplementary Table 1. (B) Schematic representation of the transport reactions that move produced lipids to the compartment membranes with different stoichiometries (gray arrows).