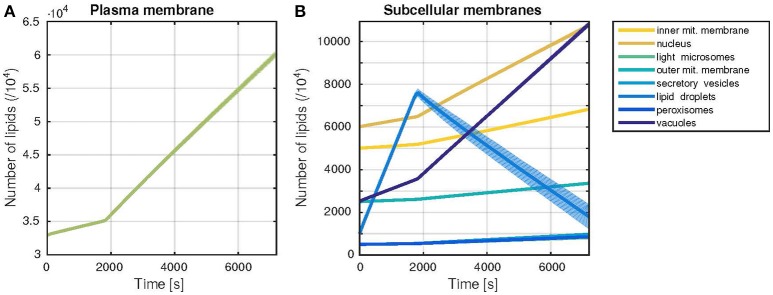
Figure 3.
Trajectories of the membrane sizes (time courses). Dynamic behavior of the model during one cell cycle, with a G1-phase duration of 30 min. The time evolution of the membrane sizes, measured by the number of lipids in each membrane is shown. Thick lines represent the mean, shaded areas the standard deviation of 1000 model simulations. (A) Plasma membrane growth (B) Growth of all other subcellular membranes occurring in the model.

