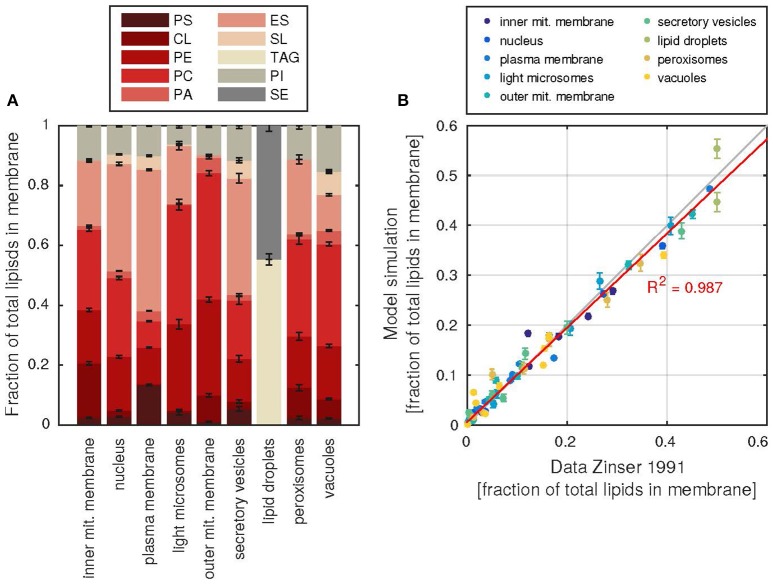
Figure 4.
Subcellular membrane composition and agreement with data. (A) The relative contributions of each lipid class (abbreviations as in Table 1) to the total number of lipids in each membrane. Error bars denote the standard deviation of 1000 model simulations. (B) Agreement of the simulate fractions with the data of Zinser et al. (1991), each dot represents the fraction of a lipid in a subcellular membrane, all fractions of one membrane are colored according to the color key above. The red line describes a linear regression line between model and data fractions, the resulting coefficient of determination R2 is shown. Error bars as in (A).

