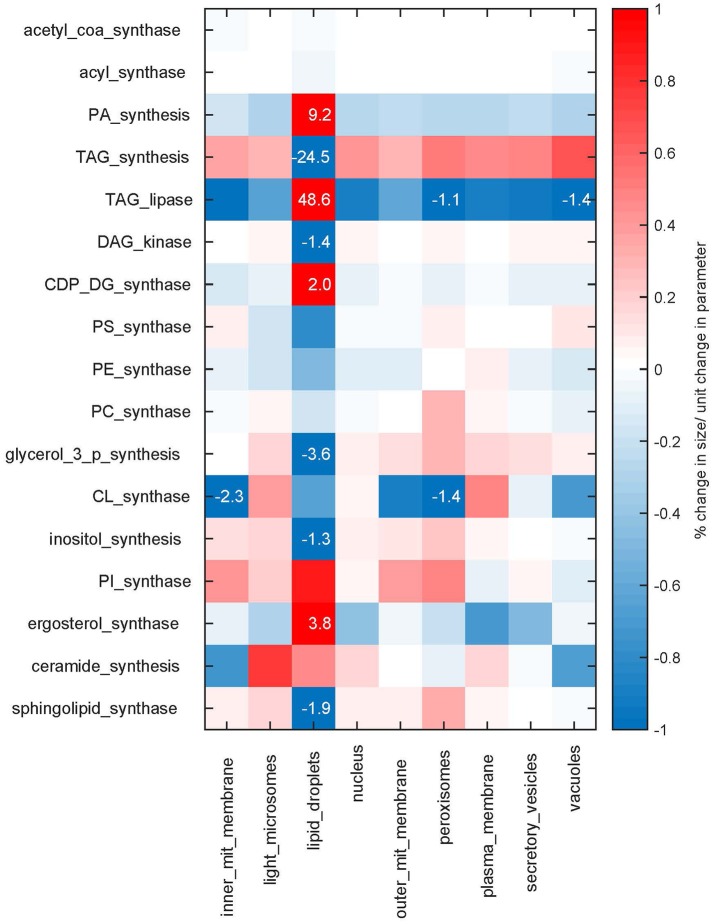
Figure 5.
Sensitivities. Sensitivities of the membrane sizes to changes in the maximum rates Nmax of the synthesis reactions. The sensitivities are shown as percent of change in membrane size upon a parameter change of one unit. Sensitivities are color coded, values larger than one percent are additionally given as numbers.

