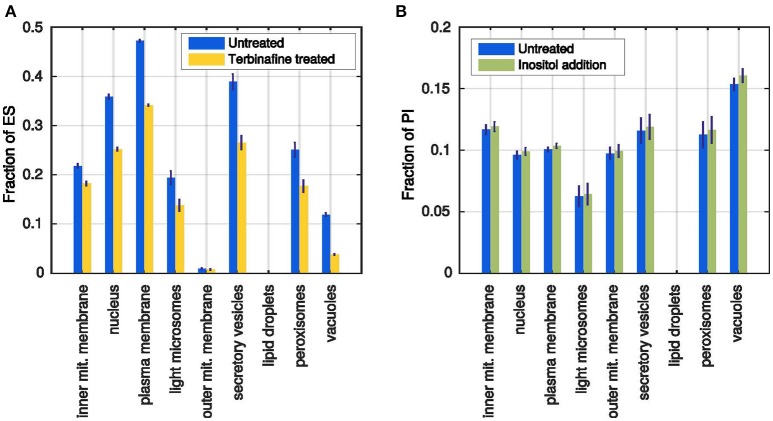
Figure 6.
Simulated test cases of the model behavior. (A) Ergosterol content in each membrane after simulation of the terbinafine treatment (yellow) in comparison with previous untreated simulations (blue). (B) Fractions of PI in all membranes after standard simulation (blue) and simulated inositol addition (green). Error bars represent standard deviations of 1000 simulations.

