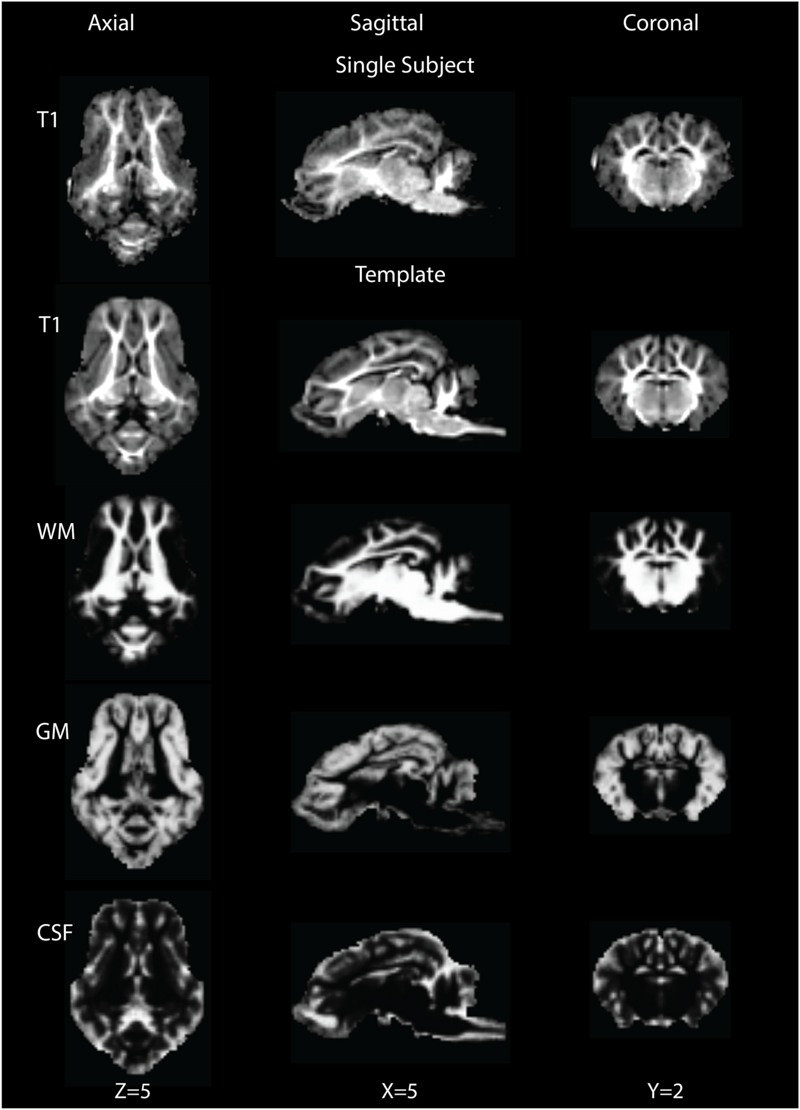
FIGURE 1.

Single subject T1 image (row 1) and template T1 image (row 2) are shown in the axial (Z = 5), sagittal (X = 5) and coronal (Y = 2) views. Rows 3∼5 show tissue probability maps for white matter (WM), gray matter (GM) and cerebrospinal fluid (CSF) in the template space.
