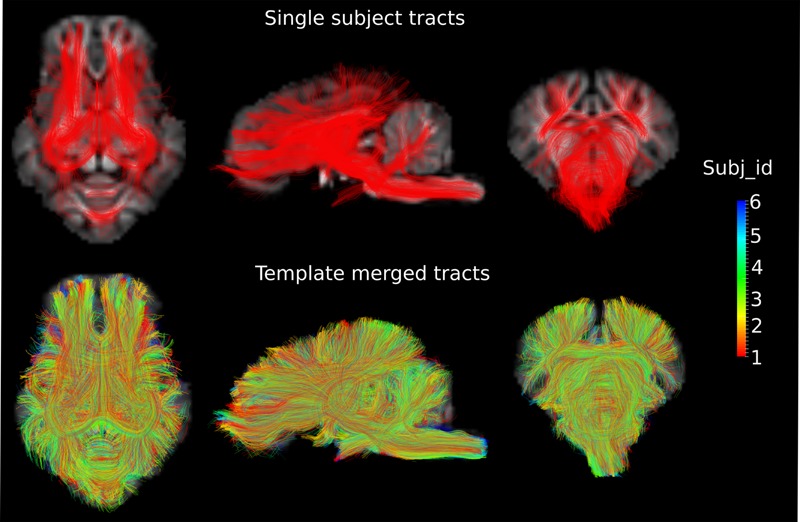
FIGURE 3.

Fiber tracts from a single subject and a group of subjects are shown in the axial (Z = 3), sagittal (X = 0) and coronal (Y = -1) views in the template space, with the template T1 image as the background. Different colors represent the fibers from different individuals.
