FIGURE 4.

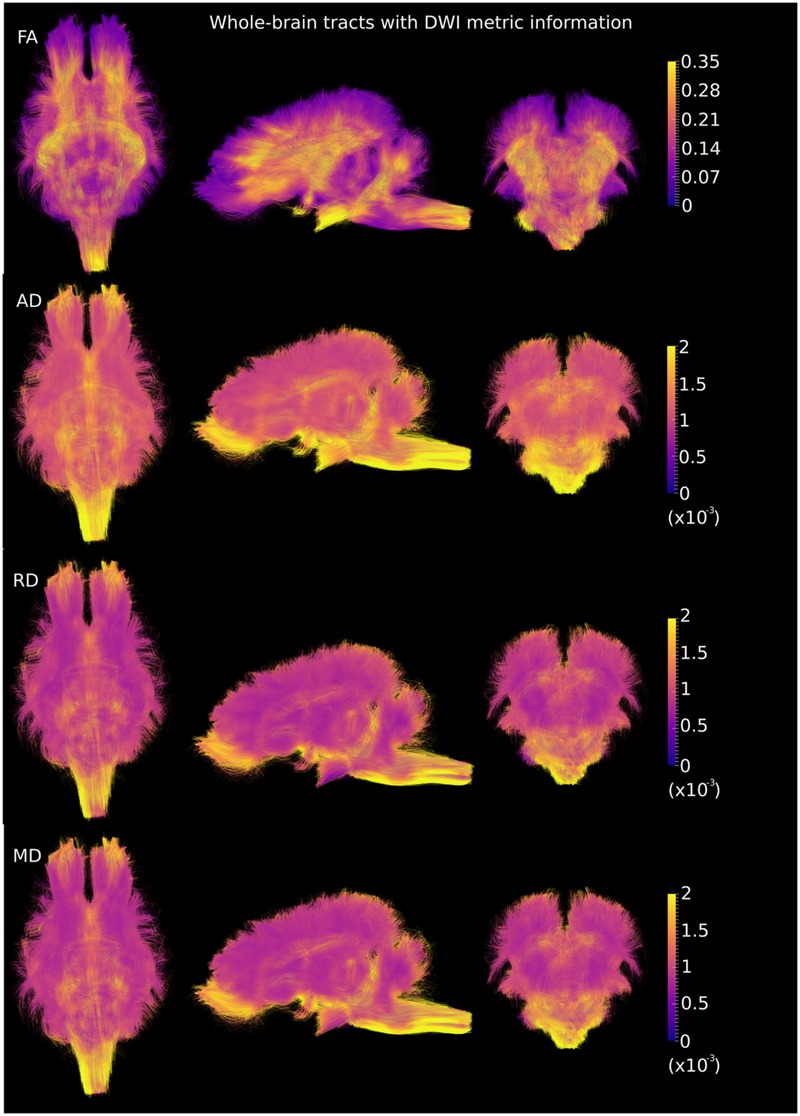
Merged whole-brain fiber tracts overlaid with DWI metrics (with the same value scale as in Figure 2) in the axial, sagittal and coronal views. Brighter color represents higher values.

Merged whole-brain fiber tracts overlaid with DWI metrics (with the same value scale as in Figure 2) in the axial, sagittal and coronal views. Brighter color represents higher values.