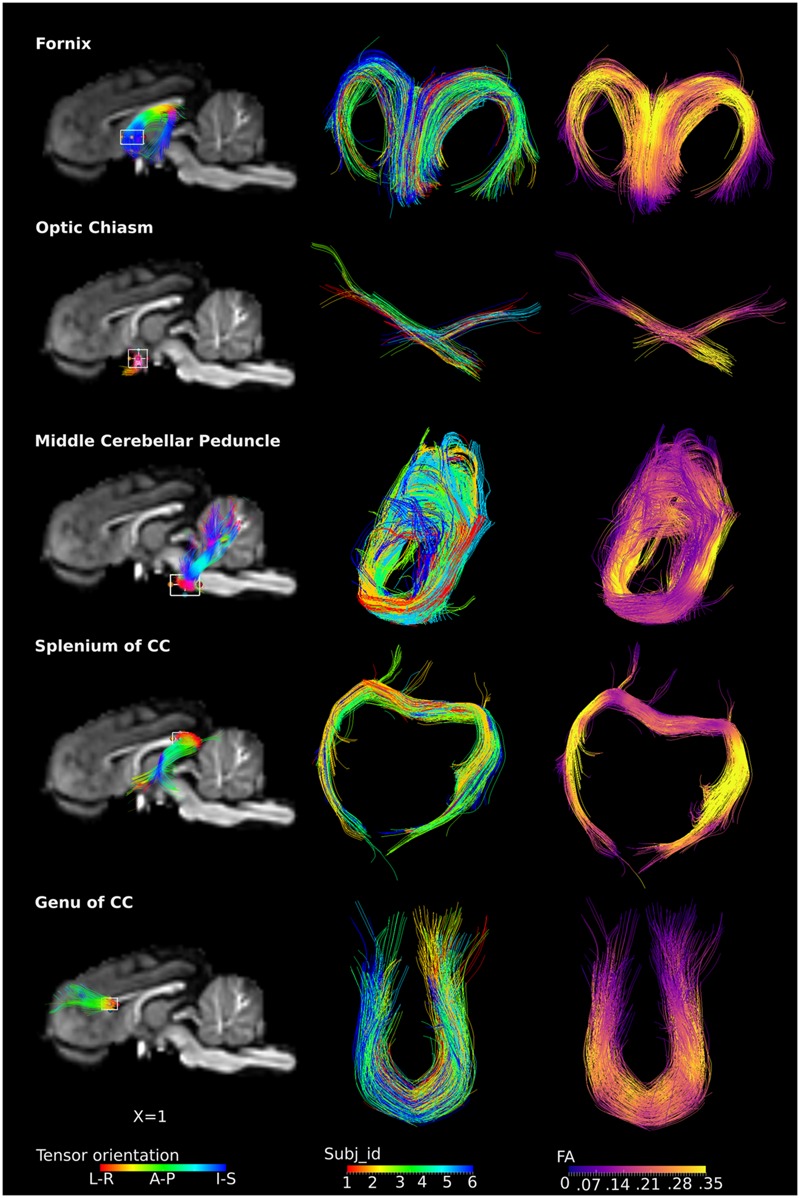
FIGURE 5.

ROI-specific fibers from fornix, optic chiasm, middle cerebellar peduncle, and splenium and genu of CC. Column 1 shows the location of the ROIs with a rectangular box, the overlaid fiber tracts are colored by the tensor orientation. Column 2 shows the extracted fibers, with each color representing fibers from each individual. Column 3 shows the extracted fibers colored by the FA values, with brighter color representing higher FA values.
