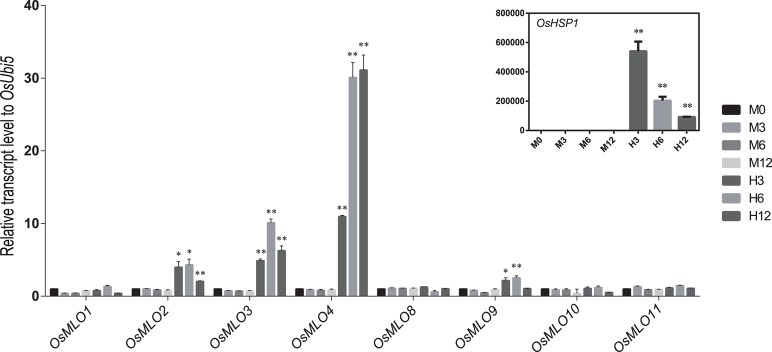
Figure 7.
Expression profiles of OsMLO genes under heat stress evaluated by real-time PCR analysis. OsHsp1 served as a positive marker for heat-stress response. OsUbi5 was used as internal control. M, control treatment; H, high-temperature treatment. Numbers after M and H indicate time points (hours) after stress treatment. **p < 0.01; *0.01 < p < 0.05.

