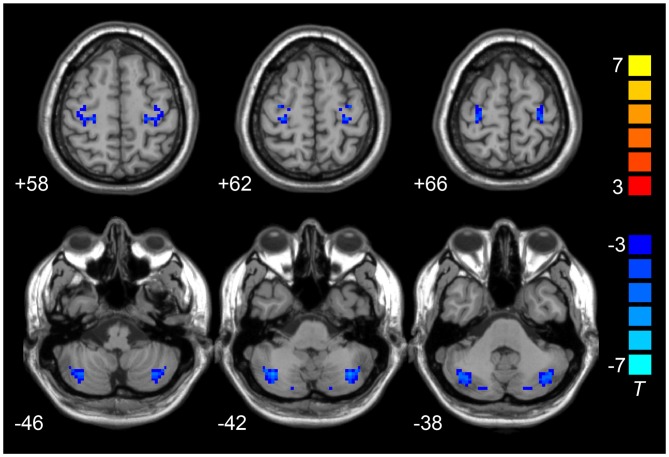
Figure 2.
Results of split-half sample validation. Comparisons of VMHC were analyzed between 16 LOD and 18 HCs. Blue color represents reduced VMHC value in LOD. The numbers at the down left of each image refer to the z-coordinates in Montreal Neurological Institute template. The threshold was set at a corrected P < 0.001 (corrected with P < 0.01 for each voxel and cluster volume ≥55 voxels) and the t-score bar is present at the right-side. Notes: HCs, Healthy Controls; VMHC, Voxel-Mirrored Homotopic Connectivity; LOD, Late-Onset Depression.

