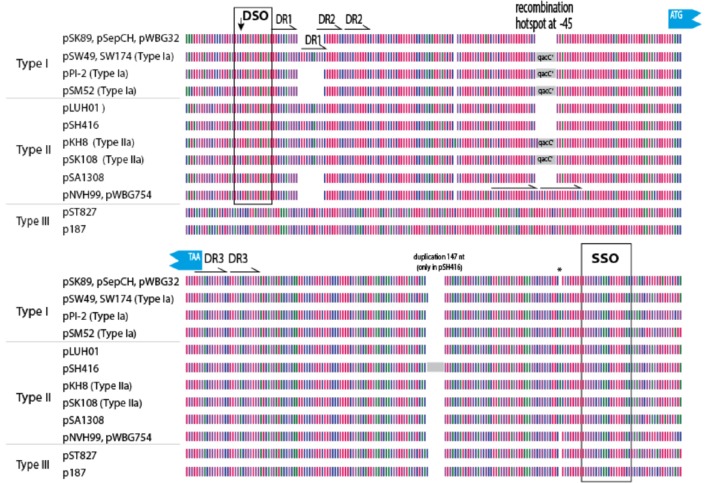
Figure 2.
Graphical representation of 200 qacC upstream (top) and downstream (bottom) sequences. Nucleotides are represented by color with A (red), T (purple), G (green), and C (blue). DSO, double-strand origin of replication; DR, direct repeat; SSO, single-strand origin of replication. Other features indicated are discussed in the text.

