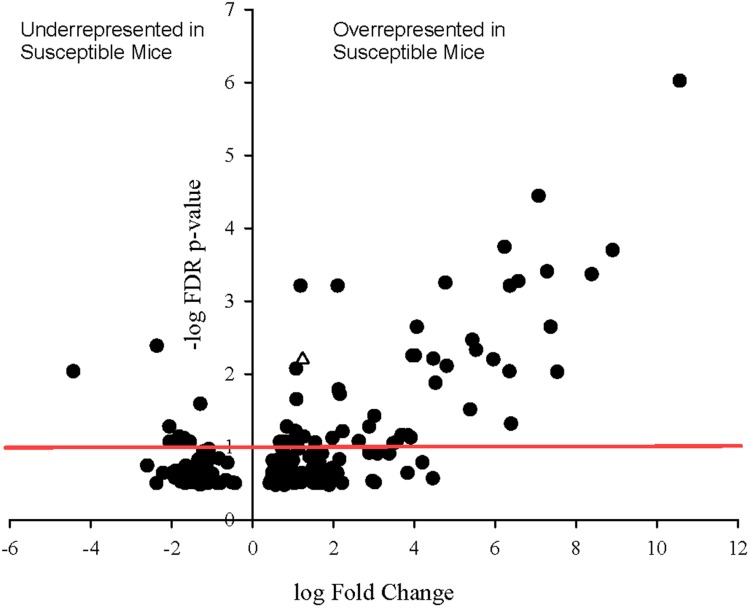
FIGURE 5.
Volcano plot showing degree of differential expression of bacterially derived genes in Charles River Laboratories mice compared to Taconic Biosciences. Log-transformed fold change in expression is plotted on the x-axis and log-transformed false discovery rate-adjusted p-values plotted on the y-axis. The red horizontal line represents the 0.1 p-value cutoff. Empty triangle: fliC (Flagellin).

