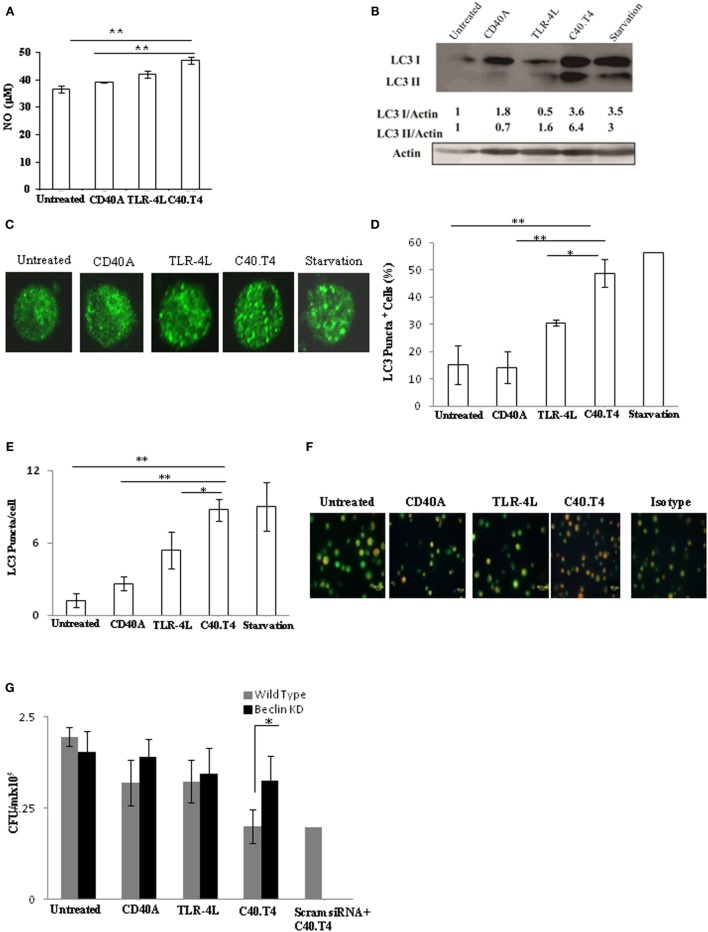
Figure 6.
Triggering through C40.T4 showed augmentation in autophagy. DCs infected with Mtb were stimulated through C40.T4, CD40, TLR-4 for 24 h and assessed for (A) NO in SNs by Greiss assay. (B) Expression of LC3 was detected in the whole cells lysates of DCs stimulated for 2 h through C40.T4 by immunoblotting. Actin was used as a loading control. Densitometric data show the LC3I/actin and LC3II/actin ratio. (C) LC3 puncta formation was demonstrated by immunofluorescence staining. Starved DCs were used as a positive control; (D,E) Bar graphs depict the percentage of LC3 puncta positive cells and LC3 puncta per cells, respectively. (F) DCs were stimulated through C40.T4 for 5 h were later incubated with acridine orange for 15 min to visualize autophagosomes by fluorescence microscopy (40×). Orange dots indicate the acidic vacuoles. (G) BeclinKD DCs were infected with Mtb followed by stimulation with C40.T4. Later, cells were lysed and bacterial burden was quantified by CFU assay. Data represented as the mean ± SD (A,D,E,G); immunoblotting (B); fluorescent microscopy (C,F); are of 2–3 independent experiments. “*” and “**” indicate p < 0.05 and p < 0.01, respectively.

