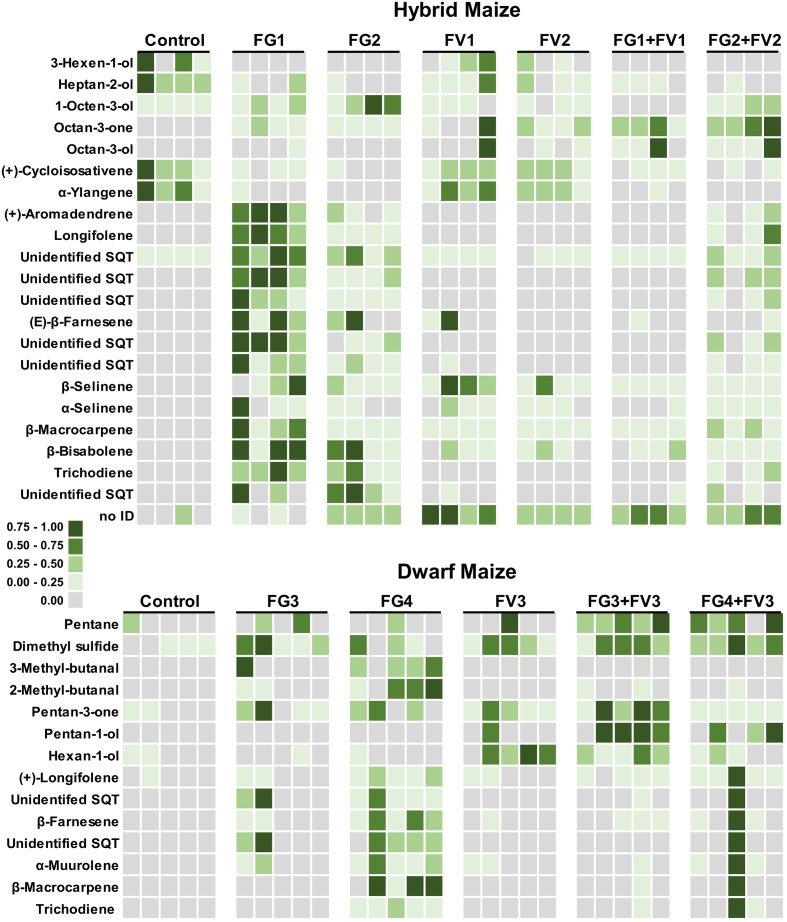
FIGURE 5.
Heatmap representing volatiles that are regulated in dwarf and hybrid maize upon infection with Fusarium. Squares correspond to the concentration of single volatiles emitted from independent ears for each treatment – dwarf maize, n = 5 replicates per treatment; hybrid maize, n = 4 replicates per treatment. Squares have been color coded to represent volatile concentrations (normalized from zero to one). The heatmap illustrates that volatiles are differentially regulated by single inoculations or co-inoculations of Fusarium strains. Treatments: Control, uninfected ears; FV, F. verticillioides; FG, F. graminearum. Refer to Table 1 for details about strain numbers. For hybrid maize, part of the data (control and single inoculations with FG1 and 2 and FV1 and 2) has already been described in Becker et al., 2014. The data is shown here for consistency with dwarf maize and for allowing the comparison to co-inoculations.

