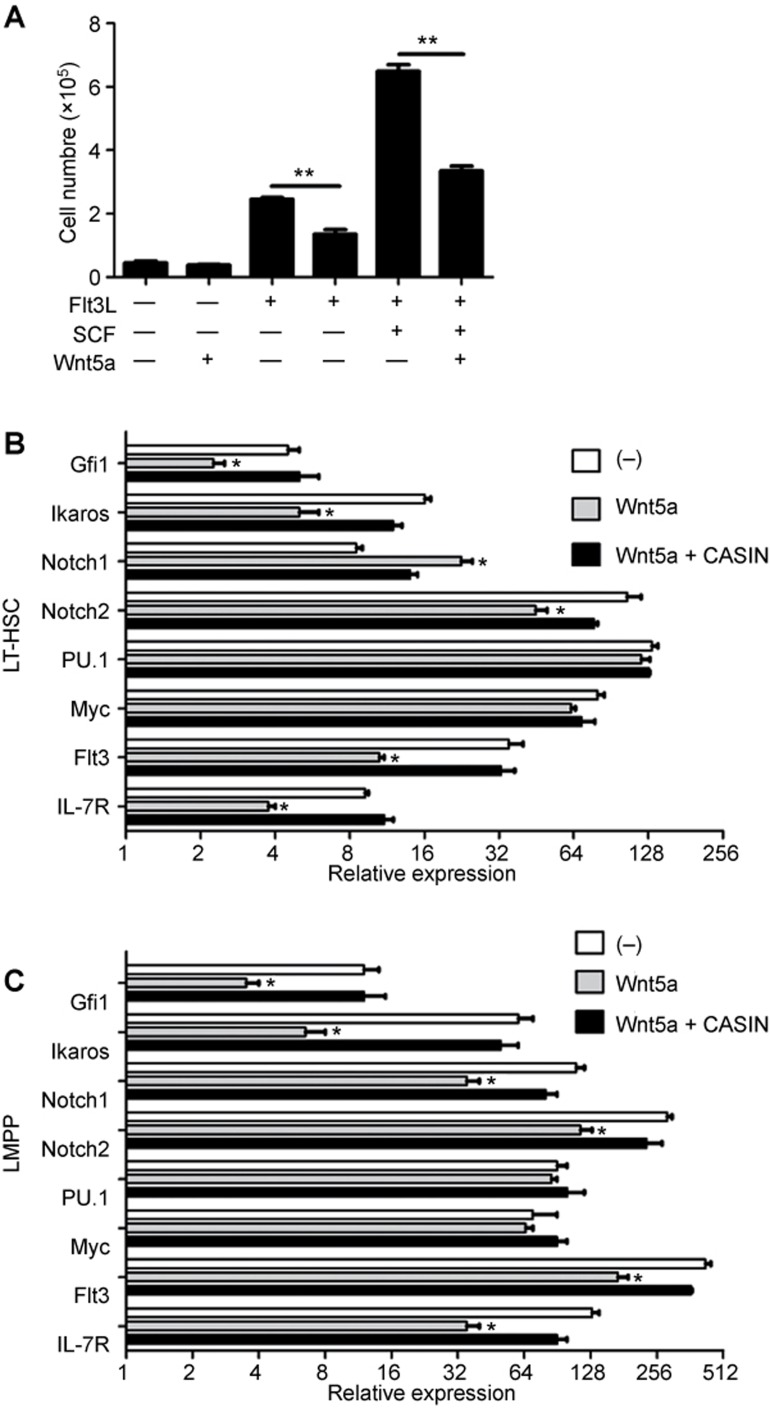
Figure 6.
Wnt5a negatively regulated the expansion of LMPP. (A) LMPP were isolated from the BM and treated with the indicated cytokines. The graph shows the proliferation of LMPP upon different stimulations. (B, C) LT-HSC or LMPP were treated with Wnt5a or Wnt5a and CASIN. (B) Graphical summary of qPCR analysis showing the mRNA levels of Gfi-1, Ikaros, Notch1, Notch2, PU.1, Myc, Flt3, and IL7R in LT-HSC. (C) Graphical summary of qPCR analysis showing the mRNA levels of Gfi-1, Ikaros, Notch1, Notch2, PU.1, Myc, Flt3, and IL7R in LMPP. Data are representative of two independent experiments. Error bars represent SEM (*P < 0.05, **P < 0.01).

