Figure 4.
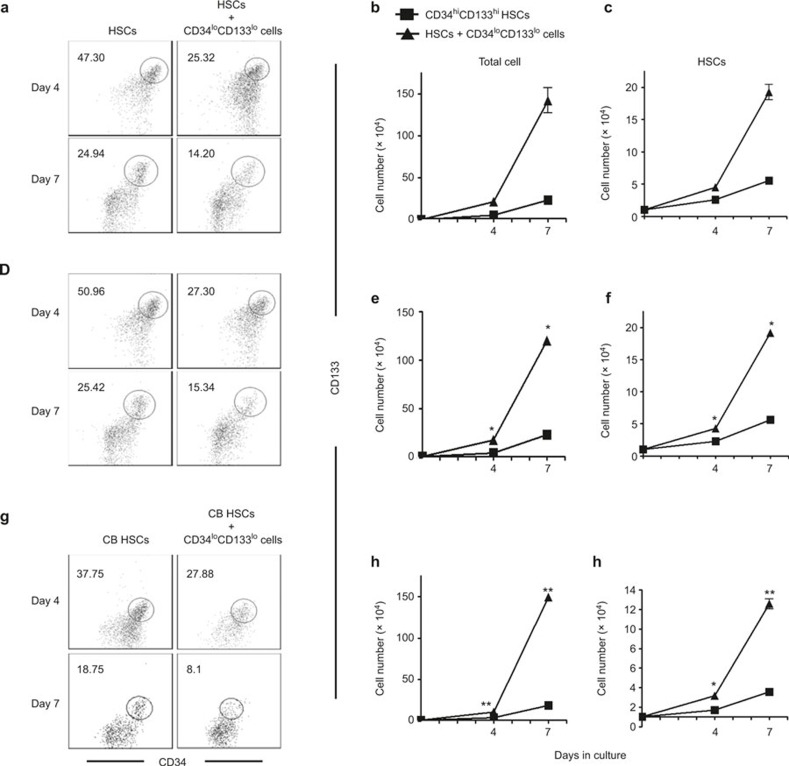
Ex vivo expansion of HSCs by co-culture with CD34loCD133lo cells. CD34hiCD133hi HSCs and CD34loCD133lo cells were purified from FL CD34+ cells by sorting. CD34hiCD133hi CB HSCs were purified from CB. Co-cultures were prepared by mixing HSCs and CD34loCD133lo cells at a ratio of 1:7. HSCs alone were used as a control culture. Non-adherent cells in the CD34loCD133lo cell co-cultures and control cultures were harvested at 4 and 7 days, counted, and analyzed for CD34 and CD133 expression. All the experiments were repeated twice. (A–C) FL CD34hiCD133hi HSCs and CD34loCD133lo cells were used for culture. (A) Representative CD34 versus CD133 staining profiles of cultured cells at day 4 and day 7 are shown. The number indicates the percentage of CD34hiCD133hi HSCs in the gated region. (B) The amount of total non-adherent cells, and (C) CD34hiCD133hi HSCs in culture. (D–F) FL CD34hiCD133hi HSCs and CD34loCD133lo cells were used for culture. Transwells were used to block cell–cell contact between HSCs and CD34loCD133lo cells. (D) Representative CD34 versus CD133 staining profiles of cultured cells at day 4 and day 7 are shown. The number indicates the percentage of CD34hiCD133hi HSCs in the gated region. (E) Numbers of total non-adherent cells and (F) CD34hiCD133hi HSCs in culture. (G–I) CB CD34hiCD133hi HSCs and CD34loCD133lo cells were used for culture. (G) Representative CD34 versus CD133 staining profiles of cultured cells at day 4 and day 7 are shown. The number indicates the percentage of CD34hiCD133hi HSCs in the gated region. (H) Numbers of total non-adherent cells and (I) CD34hiCD133hi HSCs in culture. Data are shown as the mean ± SEM of 2 independent experiments. *p <0.05.

