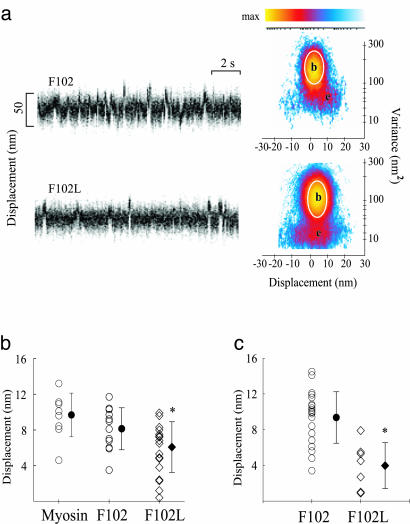
Fig. 5.
Single-molecule laser trap data from chicken skeletal myosin with F102 and F102L. (a) Representative data trace for F102 and F102L RLC-exchanged myosin. Myosin-binding events are characterized by a change in mean position associated with a reduction in variance. Shown are raw time traces (Left) and MV histograms (Right) representing myosin with F102 and F102L RLCs. MV histograms were calculated with a 20-ms time window by transforming the entire record (≅30–60 s) from which representative traces were taken. Note that the event population amplitudes, e, shown in the F102L histograms, are roughly half those of the F102 MV histogram. (b) Scatter plots representing the distributions of d produced by myosin, F102 RLC-exchanged myosin, and 60% F102L RLC-exchanged myosin. Mean values (filled symbols) and standard deviations are represented for each distribution. Values were obtained from three F102 (8.1 ± 2.4 nm) and F102L RLC-exchanged (6.1 ± 2.8 nm) myosin preparations. Each entry represents a fit from a single MV histogram, which may be comprised of 50–100 unitary events depending on the record duration and event density. (c) Scatter plots representing the distributions of d produced by myosin-reconstituted with total light chains. Mean values (filled symbols) ± SD are represented for each distribution. Values were obtained for two myosin preparations reconstituted with F102 (9.6 ± 2.7 nm) or F102L RLCs (3.8 ± 2.4 nm). *, The difference between myosin with the F102 vs. F102L RLC was significant at the P < 0.001 level by Student's t test.

