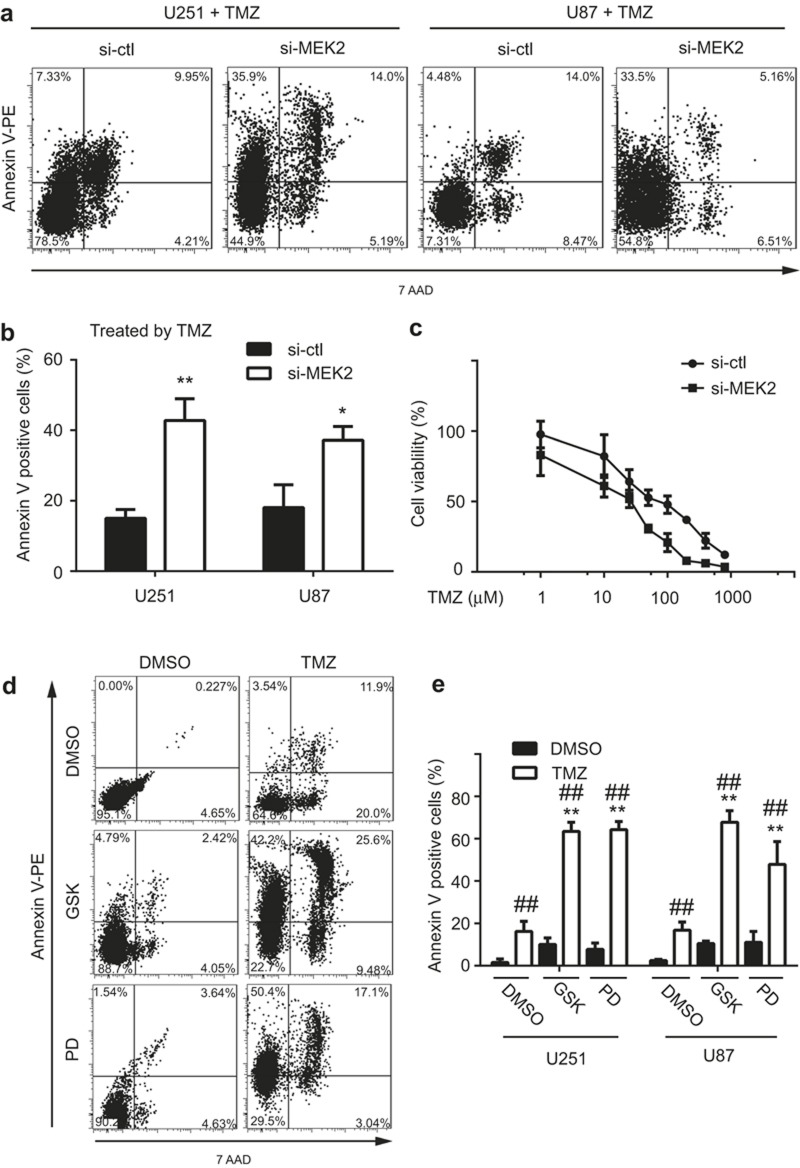
Figure 4.
The effect of MEK2 expression on the temozolomide sensitivity of glioma cells. The representative plots (a) and statistical results (b) of the apoptotic rates of U251 and U87 cells with MEK2 silenced (si-MEK2) or its control group (si-ctl) treated with 100 μM temozolomide (TMZ) for 48 hrs as measured by Annexin V staining. **P < 0.01, *P < 0.05 vs si-ctl. (c) The inhibition curve of U251 with MEK2 silenced (si-MEK2) or its control group (si-ctl) treated with 1, 10, 25, 50, 100, 200, 400, or 800 μM TMZ and measured by MTT assay. The representative plots (d) and statistical results of the apoptotic rates (e) of U251 and U87 cells with MEK2 silenced (si-MEK2) or its control group (si-ctl) treated with 100 μM TMZ and MEK inhibitors (GSK: GSK1120212 at 10 nM, PD: PD184352 at 50 nM) for 48 hrs as measured by Annexin V staining. **P < 0.01, *P < 0.05 vs. DMSO + TMZ group; ##P < 0.01 vs. DMSO within each treatment. All results are expressed as the mean ± SD from at least three independent experiments.

