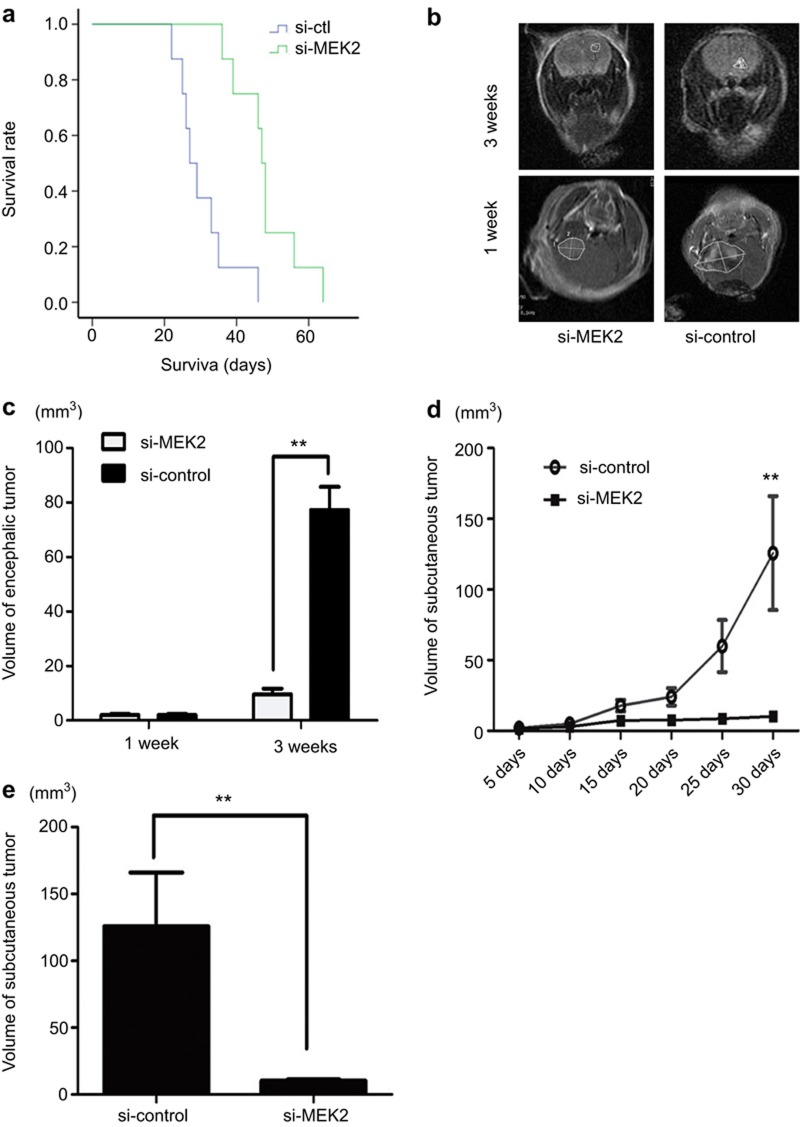
Figure 6.
Effect of the Inhibition of MEK2 on chemotherapy sensitivity to TMZ in vivo. (a) Nude mice were intracranially transplanted with 5 × 10⁵ glioma cells infected with Si-MEK2 or Si-ctl (control). The survival curve was plotted by Kaplan–Meier analysis. Mice-bearing gliomas from Si-MEK2-infected U87 cells treated with TMZ survived longer than those in the control group (n = 8 per group). Each curve was compared using the two-sided log-rank test. P < 0.001, Si-MEK2 vs. Si-ctl. The number of mice at risk at each time point is also shown. (b) Representative tumor images were obtained by MRI 1 or 3 weeks after glioma transplantation. (c) Tumor size was quantified and analyzed. (d) In the subcutaneous model, the tumor volumes in Si-MEK2- and Si-ctl-infected groups treated with TMZ (n = 8 per group) were determined every 5 days for 30 days after implantation of U87 cells. The means and upper 95% confidence intervals are shown, Si-MEK2 vs. Si-ctl. P values were calculated using the two-sided student's t-test. (E) The volume of xenografted tumors on day 30 of implantation. Error bars represent the interquartile range. *P = 0.013, Si-ctl vs. Si-MEK2, P values were calculated using the two-sided student's t-test.

