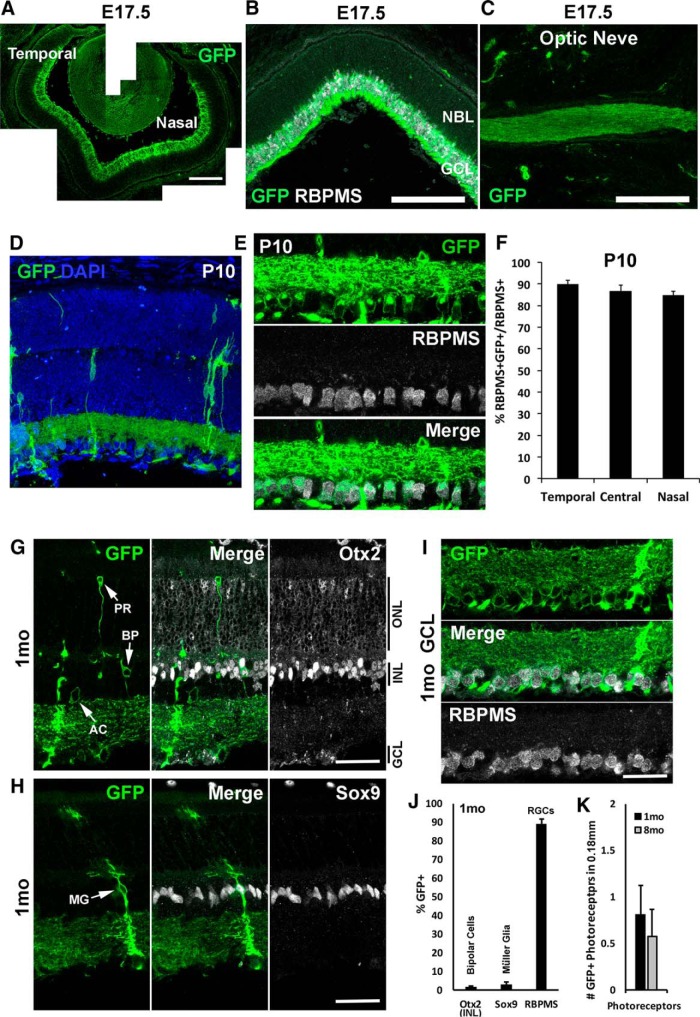
Figure 2.
Tα1-Cre mice were crossed to mTmG Cre reporter, and GFP expression was analyzed at E17.5, P10, and 1 and 8 months. A and B, At E17.5, Cre expression (GFP+) was detected in the GCL without regional bias. GFP colocalized with pan-RGC marker RBPMS (white). C, GFP was detected in the optic nerve at E17.5, indicating Cre expression in RGCs. D, Very few cells other than RGCs expressed Cre (GFP+) at P10. E, Most RGCs (RBPMS+) expressed Cre (GFP+) at P10. Representative images at the temporal retina are shown. F, Approximately 90% of RGCs expressed Cre by P10, and there was no regional bias. Error bars represent SEM (n = 4). Central, >0.25 mm from ONH; temporal and nasal, 1 mm from ONH. G–K, Cell type–specific markers were used to analyze Cre expression in the retina at 1 month. Very few bipolar cells (BP; Otx2+ in INL; G, J), amacrine cells (AC; G), photoreceptors (PR; G, K), or Müller glia (MG; Sox9+; H, J) expressed Cre, whereas Cre expression was detected in ∼90% of RGCs (RBPMS+; I, J). Cre-expressing photoreceptor numbers did not increase in older retinas (8 months) compared with 1 month (K). Error bars in J and K represent SEM (n = 3). NBL, neuroblastic layer. Scale bars, 250 μm (A–C) and 50 μm (G–I).

