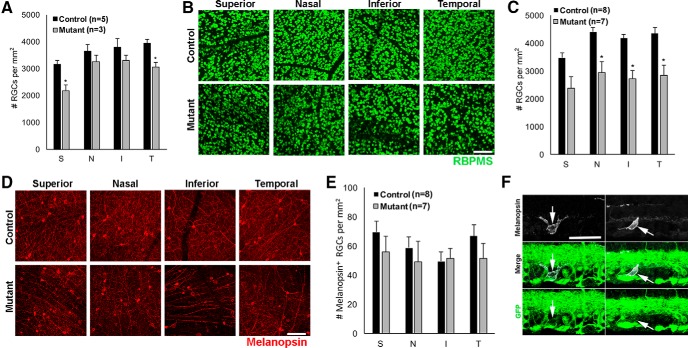
Figure 7.
Melanopsin+ ipRGCs were resistant to degeneration. All images were taken at 1 mm from the ONH, and numbers of RBPMS+ (total RGC marker) or melanopsin+ (ipRGC marker) cells were counted manually in superior (S) nasal (N), inferior (I), and temporal (T) leaflets. A, At 6 months, the mean number of RGCs was significantly lower for mutant mice in superior and temporal retinas (p = 0.01 and 0.02 with ANOVA and Tukey’s honestly significant difference test). B, Representative RBPMS labeling of the 9-month control and mutant retinas. C, At 9 months, the mean number of RGCs was significantly lower for mutant mice in nasal, inferior, and temporal retinas (*p = 0.02, 0.03, and 0.02 with ANOVA and Tukey’s honestly significant difference test). D, Representative melanopsin labeling of 9-month control and mutant retinas. E, At 9 months, there was no significant difference in ipRGC counts between control and mutant retinas. F, Cre expression in melanopsin+ RGCs was analyzed in Tα1-Cre;mTmG Cre reporter retinas at P10. Ten melanopsin+ cells were found in three different Cre reporter retinas, and all 10 were GFP+, suggesting that ipRGCs express Cre. Two representative cells are shown (arrows). Error bars in A, C, and E represent SEM. Scale bars, 100 μm (B and D) and 50 μm (F).

