Fig. 1.
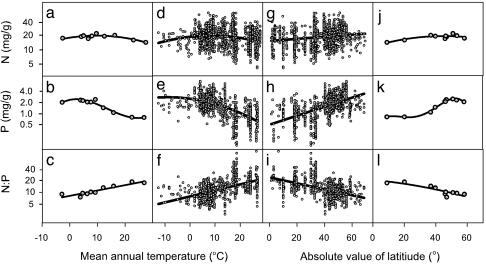
Leaf N, P, and the leaf N/P ratio in relation to MAT and absolute latitude for all species averaged by species (d–i) and pooled within temperature bins (a–c and j–l). For all species, the fits for MAT were for leaf N (r2 = 0.05, P < 0.0001, n = 1,251) (d), leaf P (r2 = 0.39, P < 0.0001, n = 907) (e), and leaf N/P(r2 = 0.31, P < 0.0001, n = 894) (f). The fits for absolute value of latitude were for leaf N (r2 = 0.04, P < 0.0001, n = 1,235) (g), leaf P (r2 = 0.34, P < 0.0001, n = 908) (h), and leaf N/P(r2 = 0.24, P < 0.0001, n = 878) (i). For species in temperature bins (n = 10), the fits for MAT were for leaf N (r2 = 0.75, P < 0.008) (a), leaf P (r2 = 0.96, P < 0.001) (b), and leaf N/P(r2 = 0.85, P < 0.0001) (c). The fits for absolute value of latitude were for leaf N (r2 = 0.69, P = 0.02) (j), leaf P (r2 = 0.98, P < 0.001) (k), and leaf N/P(r2 = 0.77, P < 0.0008) (l). The full equations (for all figures) are provided in Table 1. The number of species in each MAT bin averaged 167, with a range from 72 to 292.

