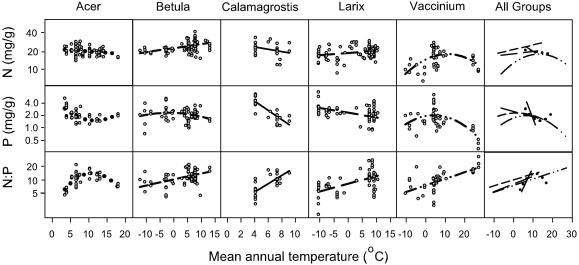
Fig. 4.
Leaf N, P, and N/P in relation to MAT for five genera are shown. The regression fits were as follows: Acer, for N (r2 = 0.06, P = 0.05, n = 70), P (r2 = 0.39, P < 0.0001, n = 43), and N/P(r2 = 0.54, P < 0.0001, n = 40); Betula, for N (r2 = 0.16, P < 0.0001, n = 86), P (r2 = 0.04, P = 0.09, n = 74), and N/P(r2 = 0.21, P < 0.0001, n = 71); Calamagrostis, for N (r2 = 0.10, P = 0.07, n = 33), P (r2 = 0.69, P < 0.0001, n = 33), and N/P(r2 = 0.57, P < 0.0001, n = 33); Larix, for N (r2 = 0.07, P = 0.005, n = 109), P (r2 = 0.22, P < 0.0001, n = 81), and N/P(r2 = 0.34, P < 0.0001, n = 80); and Vaccinium, for N (r2 = 0.23, P = 0.002, n = 50), P (r2 = 0.44, P < 0.0001, n = 47), and for N/P(r2 = 0.42, P < 0.0001, n = 45).

