Figure 1.
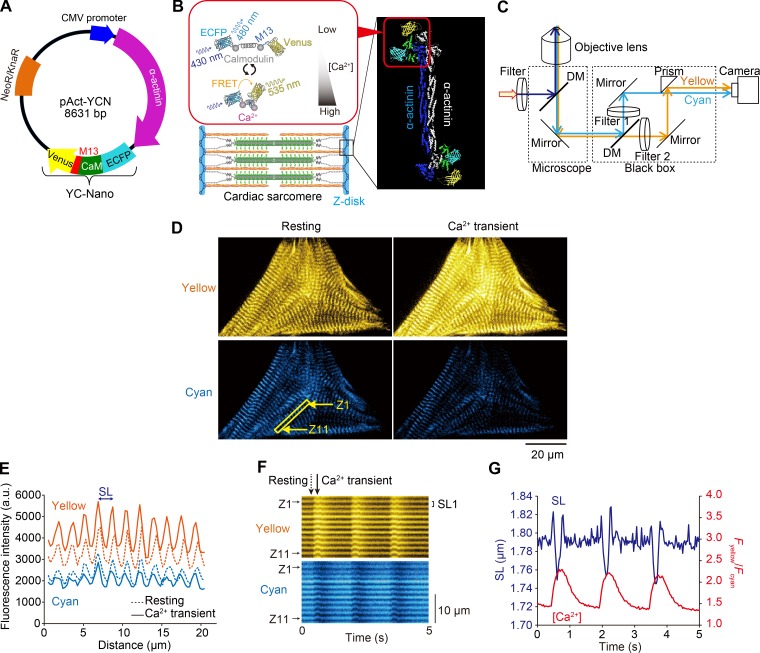
Expression of α-actinin–YC-Nano140 in sarcomeric Z disks of neonatal cardiomyocytes for simultaneous measurements of local [Ca2+]i and SL. (A) Genetic map of pAct-YCN. The plasmid was constructed by modifying pAcGFP-N1 (Takara Bio Inc.). The plasmid encodes α-actinin fused to YC-Nano below the immediate early promoter of CMV (PCMV IE) and neomycin/kanamycin resistance gene (NeoR/KnaR). (B) Illustration showing the expression of YC-Nano140 in the Z disks and that of a FRET response upon Ca2+ binding to CaM. YC-Nano (YC-Nano15, YC-Nano50, YC-Nano65, or YC-Nano140) is composed of ECFP (FRET donor), CaM, CaM-binding peptides (M13), and Venus (FRET acceptor). (C) Schematic of our dual-view fluorescence microscopic system. Yellow and cyan fluorescence signals were separated by dichroic mirrors (DM) and detected simultaneously by an EMCCD camera as a dual view (as in D). Filter 1, 467–499 nm; filter 2, 529–556 nm. Myocytes were excited by violet light (424–450 nm). (D) Epi-illumination images of a spontaneously beating myocyte at the peak of relaxation (left) and contraction (right). Yellow is the FRET acceptor (Venus), and cyan is the FRET donor (ECFP). Note clear F.I. changes for Venus and ECFP upon change in the state of the myocyte; namely, yellow F.I. increases (decreases) while cyan F.I. decreases (increases) during contraction (relaxation). See Video 1. (E) Plot profiles of Venus (yellow) and ECFP (cyan) fluorescence signals along a myofibril in D (shown by a yellow rectangle). SL is determined by the peak to peak distance of Fyellow, and the local [Ca2+] change is determined by the FRET signal (i.e., Fyellow/Fcyan). Dashed and solid lines indicate the signals at rest (D, left) and during CaT (D, right), respectively. (F) Kymographs showing changes in the longitudinal positions of the yellow (top) and cyan (bottom) fluorescence signals. “Z1” and “Z11” indicate the Z disks in the yellow outlined rectangle in D. “SL1” (distance between the peaks of yellow fluorescence) indicates sarcomere #1 along the target myofibril. Dashed and solid arrows indicate the time points at rest and during CaT, respectively, in D and E. (G) Representative graph showing a time-course of changes in Fyellow/Fcyan (i.e., local [Ca2+]i) and SL in a myocyte showing spontaneous beating at 37°C. Blue, SL; red, Fyellow/Fcyan. Note that spontaneous beating occurs with a frequency of ∼1.5 Hz in a neonatal rat cardiomyocyte, in that SL shortening (lengthening) starts in response to a rise (fall) in Fyellow/Fcyan (compare Shintani et al., 2014, 2015). Changes in [Ca2+] were determined by the mean FRET signals (i.e., Fyellow/Fcyan), and SL, by the mean peak to peak distances of Fyellow, along 10 sarcomeres in D (bottom, left).

