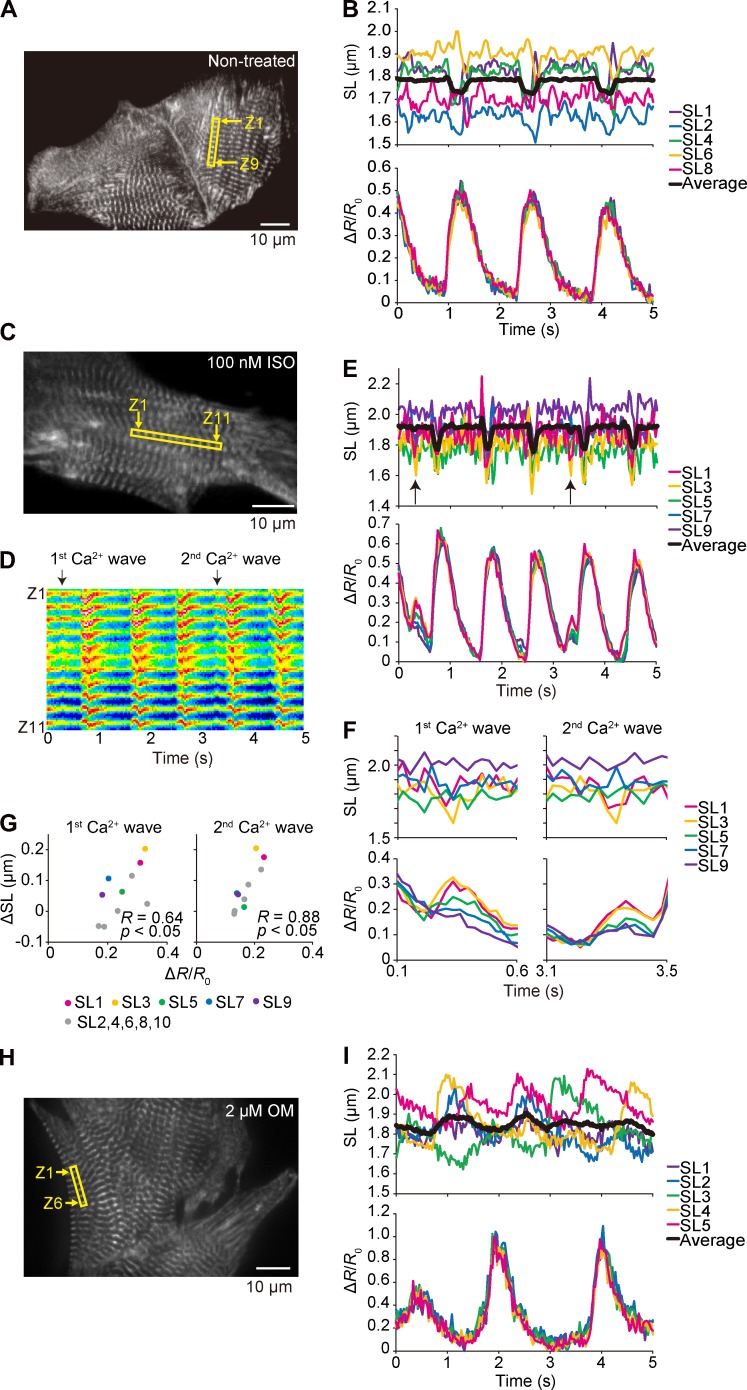
Figure 7.
Sarcomere dynamics and local [Ca2+]i along a myofibril in a cardiomyocyte under various conditions. (A) Epi-illumination image of a myocyte expressing α-actinin–YC-Nano140. Sarcomeres in the yellow rectangular region were used for the analyses on Fyellow/Fcyan and SL dynamics (Z1 and Z9, numbers of the Z disks for analyzed sarcomeres). Experiments were performed at 37°C. (B, top) Time course of changes in the lengths of five sarcomeres in a myocyte in A during spontaneous beating. Black line, superimposed data of sequentially connecting eight sarcomeres. (bottom) Time course of changes in the mean Fyellow/Fcyan of the Z disks of each sarcomere. See Video 4. (C) Same as in A, but the experimentation was performed in the presence of 100 nM ISO. Sarcomeres in the yellow rectangular region in the epi-illumination image were used for the analyses on Fyellow/Fcyan and SL dynamics (Z1 and Z11, numbers of the Z disks for analyzed sarcomeres). (D) As indicated in this kymograph of the yellow fluorescence signal (for 5 s), two major Ca2+ waves were observed during the course of imaging. (E) Time courses (5 s) of changes in SL and ΔR/R0. Arrows indicate the points at which Ca2+ waves (and the ensuing sarcomere contractions) occurred. (F) Time course (0.5 s) of changes in SL and Ca2+ waves. (G) Variances in SL versus ΔR/R0, resulting in the significant linear correlation between ΔR/R0 and ΔSL for both the first and second Ca2+ waves. See Video 5. (H) Same as in A, but the experimentation was performed in the presence of 2 µM OM. Epi-illumination image of a myocyte expressing α-actinin–YC-Nano140. Sarcomeres in the yellow rectangular region were used for the analyses on Fyellow/Fcyan and SL dynamics (Z1 and Z6, numbers of the Z disks for analyzed sarcomeres). Experiments were performed at 36°C. (I, top) Time course of changes in the lengths of sequentially connecting five sarcomeres in a myocyte in H during spontaneous beating. Black line, superimposed data. (bottom) Time course of changes in the mean Fyellow/Fcyan of the Z disks of each sarcomere. See Video 6.

