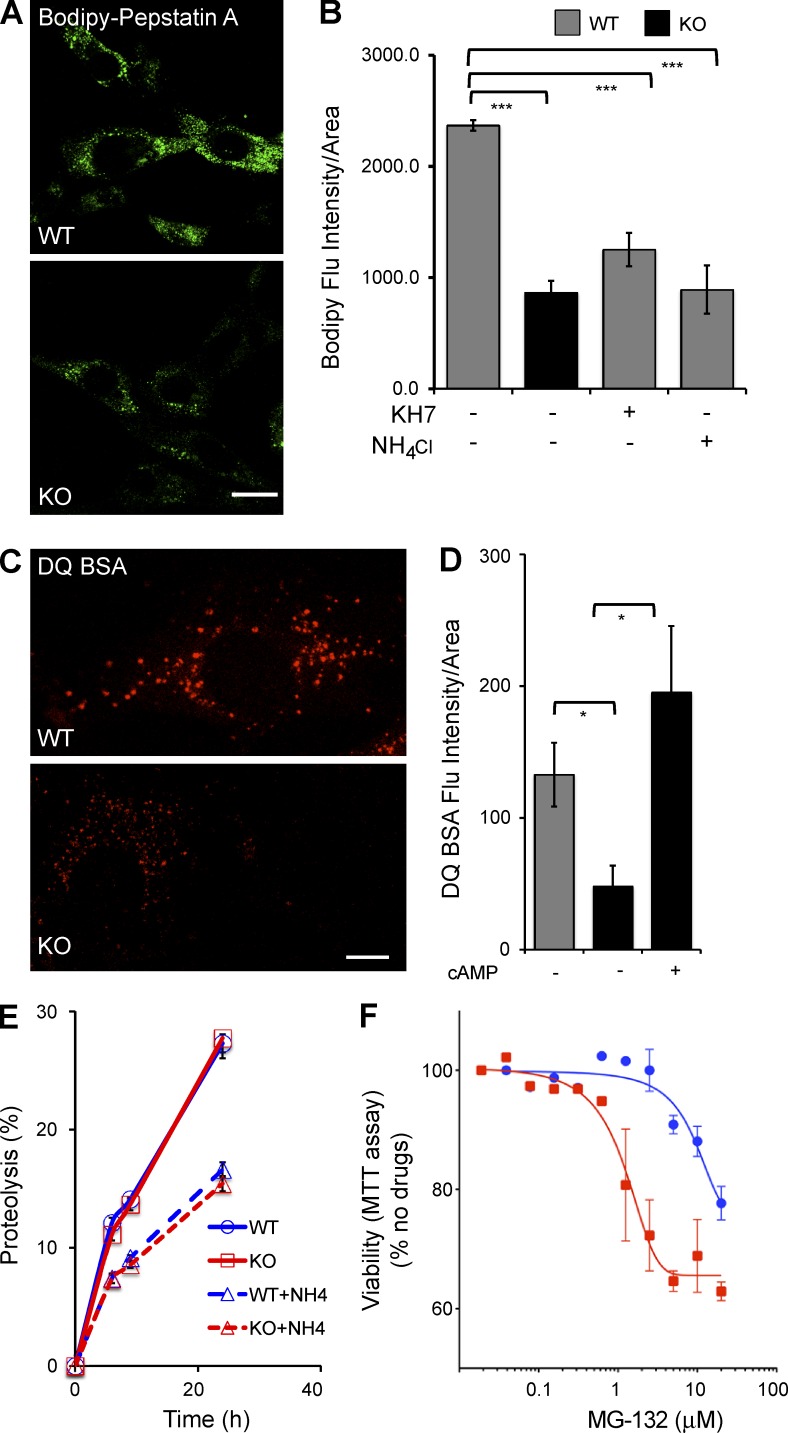
Figure 4.
Lysosomal proteolytic degradation defect in the absence of sAC. (A) Representative images of WT and sAC KO MEFs stained with BODIPY-FL–Pepstatin A. (B) BODIPY-FL–Pepstatin A intensity was quantified using MetaMorph in multiple cells from three independent experiments. All values are given as mean fluorescence intensity per cell area ± SEM. ***, P < 0.001. (C) Representative images of WT and sAC KO MEFs stained with 10 µg/ml DQ-BSA. (A and C) Bars, 10 µm. (D) DQ-BSA intensity was quantified using MetaMorph in multiple cells from three independent experiments. All values are given as mean ± SEM. *, P < 0.05. (E) Total Protein turnover is quantified as percent proteolysis (i.e., the percentage of acid-soluble radioactivity [amino acids and small peptides] divided by the initial acid-insoluble radioactivity [protein]) in WT and sAC KO MEFs after incorporation of [3H]leucine (n = 15, four independent experiment days). As control, proteolysis was assessed in the presence of NH4Cl in both WT (WT+NH4) and in sAC KO MEFs (KO+NH4). Error bars represent ±SEM. (F) WT (blue circles) and sAC KO (red squares) MEFs were plated in 96-well plates (5 × 10³ per well) and treated with increasing concentrations of the proteasome inhibitor MG132 for 24 h. The percentage of growth was determined by MTT assay. Results are presented as percent viability relative to cells in the absence of any drug; data graphed are the mean of triplicate determinations (±SEM) of a representative experiment repeated three times.

