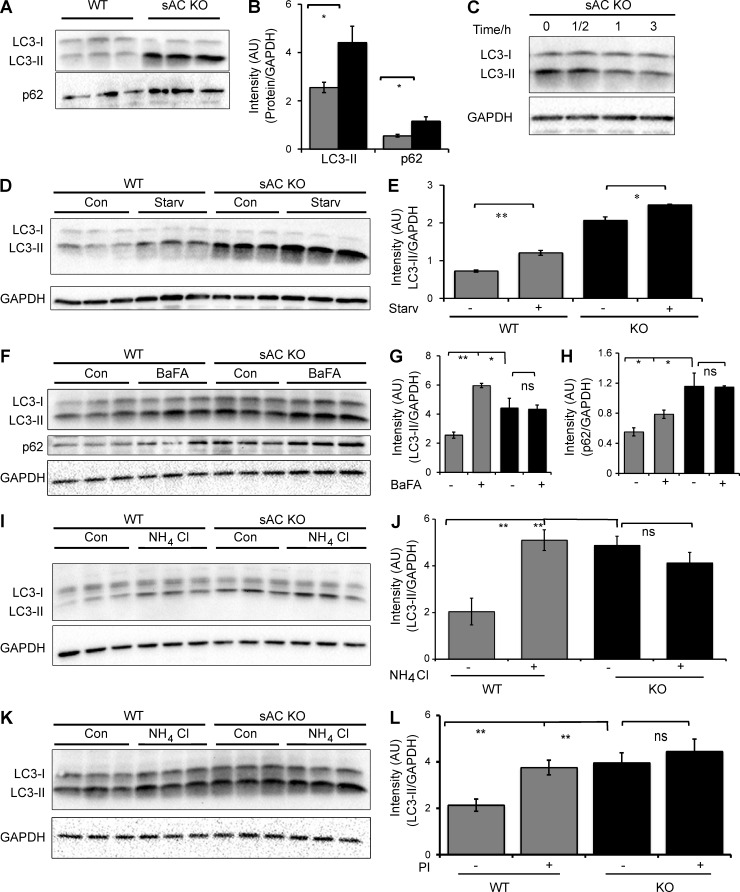
Figure 5.
APs accumulate in the absence of sAC activity. (A) Representative immunoblot of the autophagic markers LC3-II and p62 in three independent cultures of WT and sAC KO MEFs. This immunoblot is a reprobing of the blot shown in Fig. 2 A; therefore, the GAPDH control showed in Fig. 2 A is also relevant for this immunoblot. (B) Densitometric analysis of LC3-II and p62, normalized to GAPDH, in WT (gray bars) and sAC KO (black bars) MEFs. n = 6. (C) Representative immunoblot of LC3-II in sAC KO MEFs grown in the presence of 500 µM Sp-8-cpt-cAMP for the indicated time. GAPDH was used as loading control. (D) LC3-II immunoblot levels in WT and KO 3T3 MEFs after 6 h of serum starvation. GAPDH is used as loading control. (E) Densitometric analysis of LC3-II immunoblot from D normalized to GAPDH. Autophagic induction is unaltered in WT and sAC KO cells. Ratio of LC-II in starvation/control is 1.2 and 1.7 for WT and sAC KO, respectively. (F) LC3 and p62 immunoblot levels in WT and KO 3T3 MEFs with and without treatment with 100 nM Bafilomycin A1 (BafA) for 6 h. Protein levels of each protein were normalized to GAPDH as an internal control. (G) Densitometric analysis of LC3-II immunoblot from F normalized to GAPDH. n = 3. (H) Densitometric analysis of p62 immunoblot from F normalized to GAPDH. n = 3. (I) LC3 immunoblot of WT and KO 3T3 MEFs treated with 20 mM NH4Cl for 6 h. Protein levels were normalized to GAPDH as an internal control. (J) Densitometric analysis of LC3-II from I. n = 3–5 per experimental group. (K) LC3 immunoblot of WT and KO 3T3 MEFs treated with and without lysosomal protease inhibitors (PI) for 6 h (20 µM Leupeptin, 20 µM Pepstatin A, and 10 µM E64D). Protein levels were normalized to GAPDH as an internal control. (L) Densitometric analysis of LC3-II from K. n = 3–5 per experimental group. All values are given as mean ± SEM. *, P < 0.05; **, P < 0.01.

