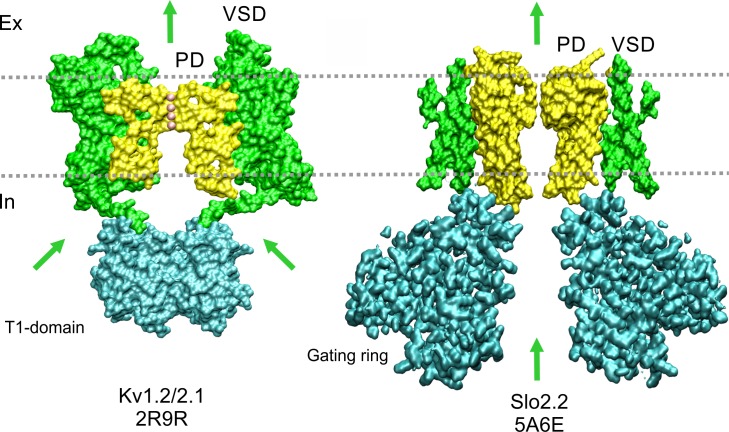
Figure 3.
K+ channel structural topology. Surface representation of Kv (Kv1.2/2.1 chimera; left) and BK (Slo2.2; right) structures. Green and yellow colors represent the voltage-sensing domain (VSD) and the pore domain (PD), respectively. The green arrows show the putative conduction paths for ions that in Kv channels K+ access/exit through the lateral windows of the “hanging” T1 domain (the gondola in cyan), whereas in BK the ions cross the entire gating ring formed by the RCK domains (in cyan). The pink spheres are K+ ions, and the horizontal discontinued lines indicate the approximate inner and outer boundaries of the membrane. External side is up. The Kv figure is a 6-Å slab prepared with VMD, with −6 < x < 0 (Humphrey et al., 1996). BK front and rear subunits are removed for clarity (inspired by Hite et al. [2015]).

