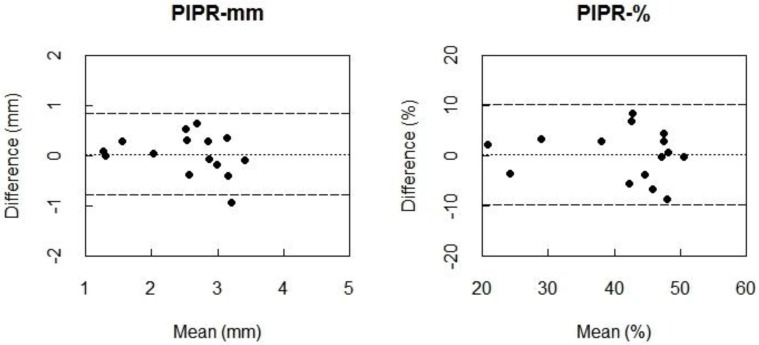
Figure 3.
Bland-Altman plots for PIPR-mm (left) and PIPR-% (right) between the two consecutive summer assessments of the protocol with intensified blue light (550 µW/cm2) with a natural pupil (550My−). Differences between the two measurements (i.e., summer session 1 minus summer session 2) are plotted against the mean of the two measurements. The dotted line represents the bias, i.e., the mean difference between all measurements of the first session and all measurements of the second session. The dashed lines are the 95% limits of agreement: 95% of the differences between the conditions lies between these lines.

