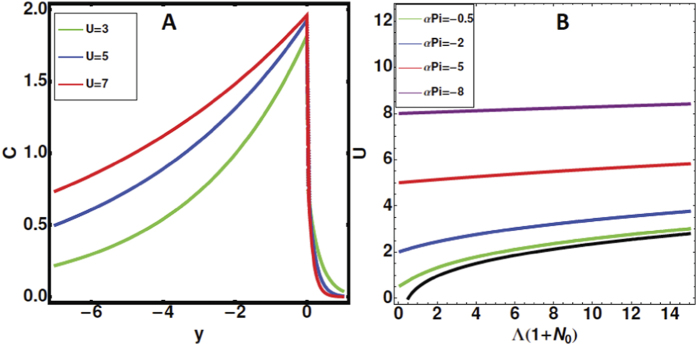
Figure 3.
Left panel (A): Density profile of the morphogens as a function of the distance from the front position y = 0, in the experimental cell. Velocities are increasing from 3 to 7 while setting N0 = 1. Right panel (B): The front velocity as a function of combined chemotactic parameters, when varying the interface pressure and setting α = 1 (see equation (8)).

