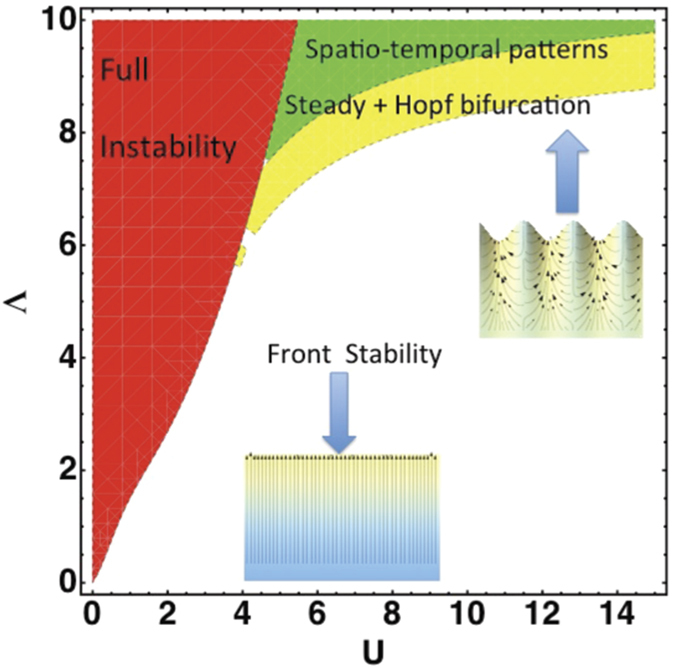
Figure 5. Phase-diagram Λ versus the averaged front velocity U for the parameter values corresponding to Fig. 4, on left: α = N0 = 1, σ = 10−3.

The fully stable domain is in white (without noise), in green the estimated weakly nonlinear domains with steady advancing periodic patterns (represented below) and Hopf bifurcation, in yellow, the domain of spatio-temporal pattern, not treated here as the fully unstable domain represented in red. In the inset, schematic representation of the steady pattern, the pressure at the interface is fixed to Pi = −6.76, giving U = 7 and k0 = 5.
