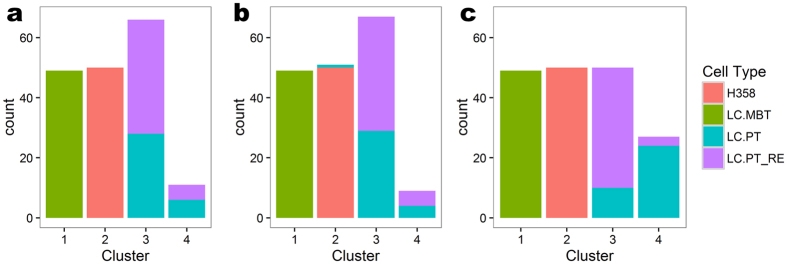
Figure 4. Bar plots of the clustering assignments for the lung adenocarcinoma cells.
(a) Original data. The LC.PT and LC.PT_RE cells split into two clusters each containing a roughly equal proportion of cells from each sample, indicating that 4-means failed to separate the cells from these two samples. (b) scLVM corrected data. Similar to the original data scLVM fails to split the LC.PT and LC.PT_RE cells into separate clusters. (c) ccRemover corrected data. The separation of the LC.PT and LC.PT_RE cells between the clusters has improved significantly with one cluster dominated by LC.PT cells and the other by LC.PT_RE cells.

