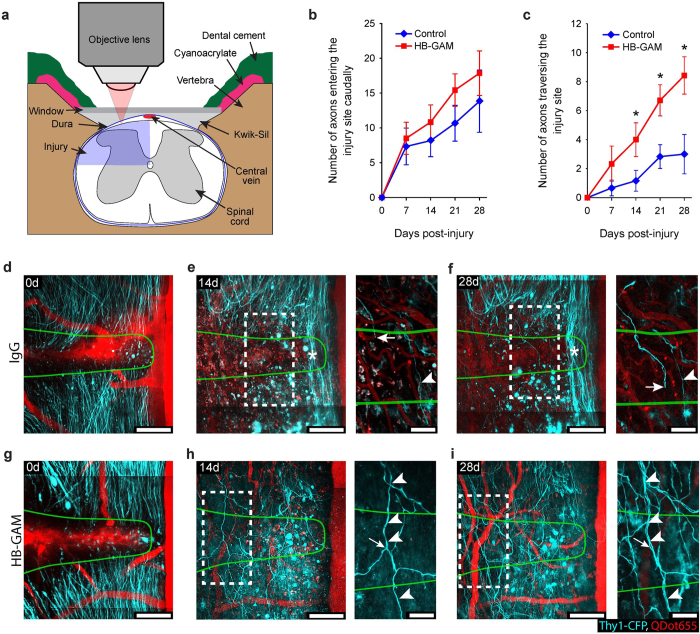
Figure 7. HB-GAM improves axon regeneration through transection injury sites in spinal cord in vivo.
(a) Experimental set-up. (b,c) Average number of axon shafts at the caudal edge of the lesion site in (b) and average number of axons that had crossed the entire rostrocaudal extent of the injury site in c over the time following IgG and HB-GAM treatment (*p < 0.05; Mann-Whitney-U test). Error bars, SEM (n = 6, controls; n = 7, HB-GAM-treated mice). (d–i) Through-depth image stacks showing sprouting of cut dorsal column axons into and across spinal cord injury sites following IgG treatment in (d–f) or HB-GAM treatment in (g–i). Caudal is up, Rostral is down. Green lines show the outlines of the injury sites as defined at 0 days. Each image is the through-depth average of multiple optical-slice images ranging from 22–35 (44–70 μm) optical slices for main images, and from 6–9 (12–18 μm) optical slices for insets. (e,f,h,i) show the same regions as shown in (d,g) respectively, at 14 and 28 days after injury. Notice the limited number of axons crossing the rostrocaudal extent of the injury site in response to IgG treatment in (e,f) compared to HB-GAM treatment in (h,i). The stars in (e,f) show region containing spared axons. Insets in (e,f,h,i) show examples of individual axons that were identified at multiple post-injury times. The arrowhead in (e,f) indicates an axon that had crossed the spinal cord injury site at 14 and 28 days. The arrow in (e,f) indicates the distal tip of the same axon within the lesion site. The arrowheads in (h,i) point to an axon that had crossed the injury site at 14 and 28 days. The arrow in (h,i) points to an axon branch located within the injury site at 14 days, but was no longer detected at 28 days. Scale bars are 100 μm for main images and in 50 μm for insets.

